


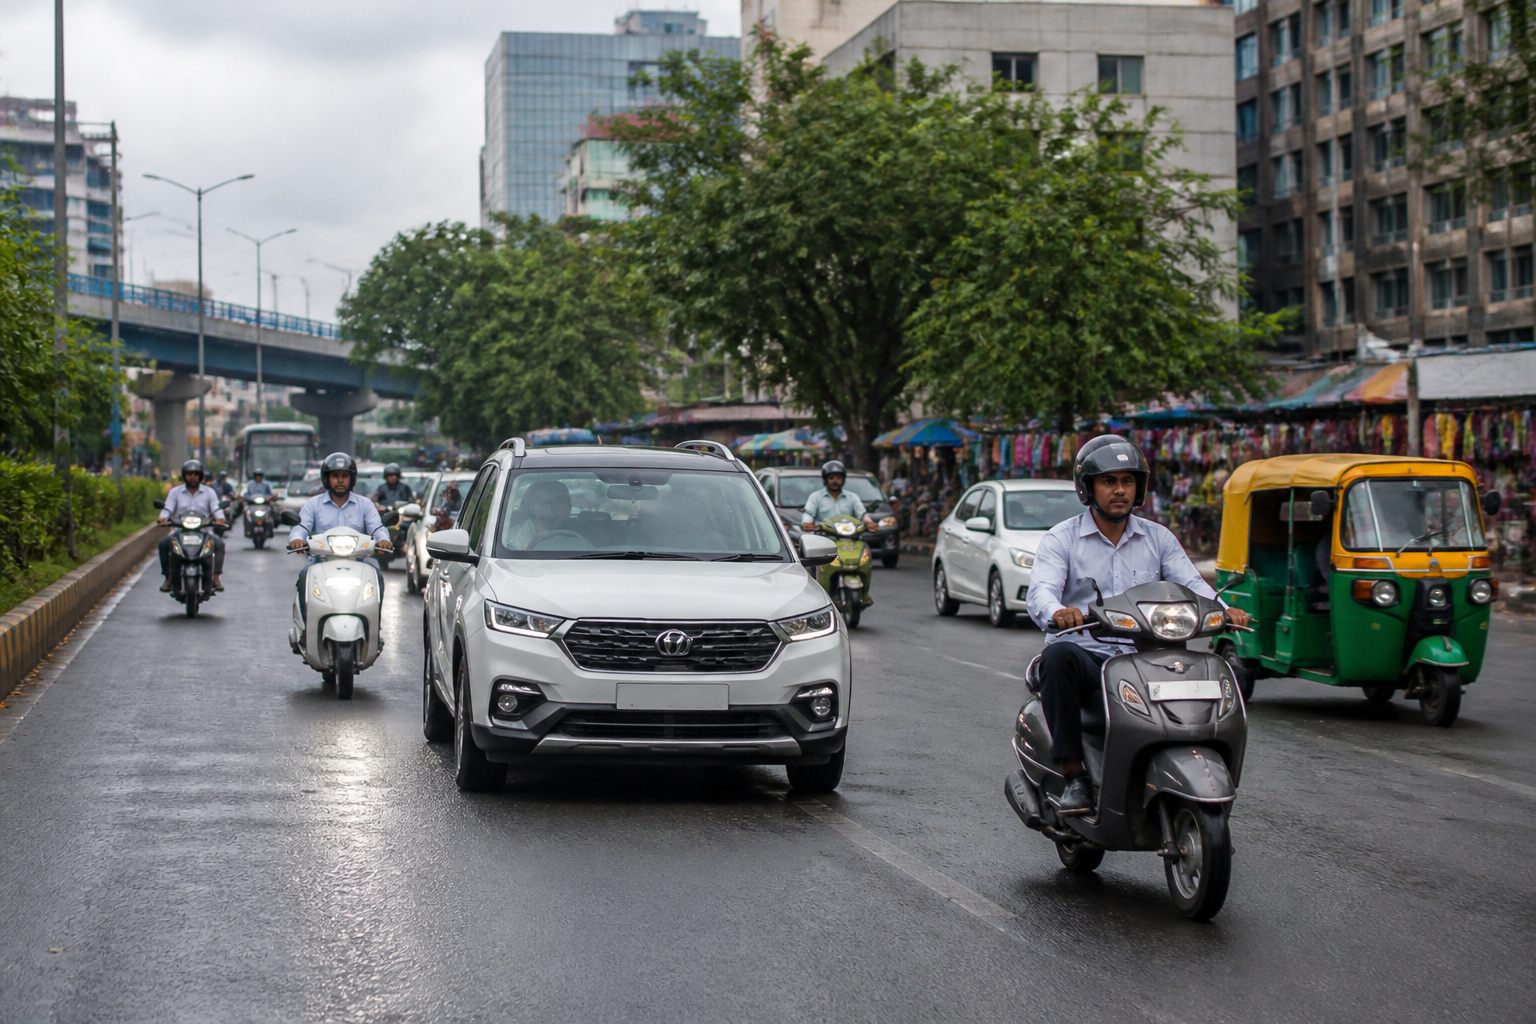
India’s record August auto sales point to more than a seasonal increase in vehicle purchases. Data released by the Society of Indian Automobile Manufacturers (SIAM) shows strong growth across passenger vehicles, three-wheelers and two-wheelers, revealing how household demand, rural consumption, financing conditions and changing powertrain preferences are reshaping mobility across the country. The scale of the increase is significant, but the underlying picture is more mixed than the headline record suggests.
Passenger vehicle domestic sales rose 36.5% year on year to 4,39,309 units in August 2026, compared with 3,21,901 units in August 2025. SIAM said this was the highest-ever August sales figure for the segment. Three-wheelers and two-wheelers also recorded their highest-ever August sales, according to SIAM Director General Rajesh Menon. The figures place personal mobility and commercial passenger transport at the centre of the current consumption cycle.
The immediate explanation is partly statistical. The August 2025 base was relatively low because consumers had delayed purchases ahead of GST rate cuts announced in September last year. Automakers subsequently reduced vehicle prices, helping revive demand. This means the year-on-year increase reflects both a genuine improvement in purchasing conditions and a comparison with a weaker period. The low base does not cancel the recovery, but it is essential to understanding its scale.
The data also shows that the passenger vehicle market is not expanding evenly across all formats. Utility vehicles were the main growth driver in SIAM’s detailed monthly report, which does not include Tata Motors’ domestic sales. Utility vehicle sales increased to 2,50,084 units in August from 1,79,613 units a year earlier. Sales of UV1 vehicles rose to 86,935 units from 59,280, while UVC sales increased to 97,881 units from 73,504.
Passenger cars in the detailed report recorded sales of 1,12,011 units, while vans contributed 11,961 units. The stronger performance of utility vehicles indicates the growing importance of larger, higher-riding vehicles in the passenger market. The supplied data does not establish why individual buyers chose these vehicles, but the sales mix confirms that the recovery is being led by a particular category rather than distributed uniformly across the market.
This shift has an urban dimension. Utility vehicles occupy more road space than many compact cars and are increasingly present on streets that already face congestion and limited parking capacity. At the same time, their popularity reflects the way mobility demand is being shaped by households that want one vehicle to perform multiple functions across city roads, intercity routes and rural areas. The sales numbers do not measure congestion or road use directly, but they show that vehicle demand is growing in a form with implications for urban space.
The two-wheeler market provides a different view of the same recovery. Total two-wheeler sales crossed 20 lakh units in August, rising to 20,34,698 units from 18,41,954 units a year earlier. Scooters supplied much of the increase, with sales rising 23.8% to 8,55,715 units from 6,91,430. Motorcycle sales were comparatively steady, increasing 2.4% to 11,33,047 units from 11,06,638, while moped sales rose 4.7% to 45,936 units.
The scooter numbers are particularly relevant to the changing geography of everyday mobility. Scooters serve household travel, education, work commutes and short-distance trips, and their expansion can be associated with both urban and rural demand. However, the source material does not distinguish sales by geography or usage, so the data cannot establish how much of the increase came from metropolitan areas, smaller towns or rural markets.
The composition of scooter sales also points to a wider powertrain transition. Electric scooters with motor power above 250 watts accounted for 1,85,303 units in August, compared with 81,017 units a year earlier. This is a sharp increase within the reported category. SIAM also cited growing consumer interest in alternative powertrains, while the source report separately noted that CNG, electric vehicles and hybrids were gaining ground in car sales.
The increase in electric scooter sales does not mean that the market has moved away from internal-combustion vehicles. Motorcycle sales remained much larger than scooter sales in the detailed figures, and the overall data does not provide a complete breakdown of electric, petrol, CNG and hybrid vehicles across all categories. What it does show is that alternative powertrains are no longer confined to a marginal part of the two-wheeler market.
Three-wheelers add a commercial mobility layer to the figures. Sales rose to 93,764 units in August from 76,324 units a year earlier. Passenger carriers accounted for 78,680 units, up from 64,294, while goods carriers increased to 13,320 units from 9,876. These categories connect vehicle demand to the movement of people and goods, particularly in local and intermediate transport systems that are often essential but receive less attention than private cars.
The electric three-wheeler figures were mixed. E-rickshaw sales declined to 1,264 units from 1,344, while e-cart sales fell to 500 units from 810. These declines sit alongside the broader growth in three-wheeler sales and show why aggregate vehicle numbers should not be treated as a simple measure of electrification. Growth in one vehicle class can coexist with weakness in another, depending on the specific use case, vehicle format and market conditions.
SIAM attributed the broader demand environment to resilient rural markets, improving financing conditions and consumer interest in alternative powertrains. These factors operate through different channels. Rural resilience can support purchases of two-wheelers and utility vehicles, financing conditions affect the ability of households and operators to buy vehicles, and powertrain preferences influence the composition of demand. The source material does not provide separate numbers for each factor, so their individual contribution cannot be measured from the available data.
The cumulative figures provide a wider frame. Total domestic sales across passenger vehicles, three-wheelers and two-wheelers reached 1.21 crore units during April-August 2026, compared with about 1 crore units in the year-earlier period. This indicates that the August increase was part of a broader recovery during the first five months of the financial year, rather than an isolated monthly event. It also suggests that the market is operating at a much larger scale than the same period a year earlier, although the source does not provide a category-wise cumulative comparison.
For urban administrators, the important issue is that vehicle demand is growing faster than the available information about its spatial consequences. The sales data records how many vehicles are purchased and which categories are expanding. It does not show where these vehicles will be used, how many will replace older vehicles, how many will be added to existing household fleets, or how they will affect parking, road capacity and public transport demand.
That gap matters because the same sales trend can produce different urban outcomes. More two-wheelers may improve access to jobs and services where public transport is weak, while also increasing traffic exposure and pressure on road space. More utility vehicles may respond to genuine household and intercity mobility needs, while adding to congestion and parking demand in dense neighbourhoods. More electric scooters may reduce tailpipe emissions at the point of use, but the data supplied does not establish their wider environmental impact or charging requirements.
The figures also underline the importance of looking beyond private vehicle sales when assessing mobility. Three-wheeler passenger carriers and goods carriers form part of the operational fabric of towns and cities, linking households, markets and transport nodes. Their growth can signal stronger local economic activity, but it also raises questions about how streets, permits, charging facilities, parking areas and loading spaces are managed. None of these institutional details are included in the SIAM data, but they determine how vehicle growth is absorbed by urban systems.
The policy landscape is therefore wider than taxation or vehicle pricing. Price reductions following GST changes helped revive purchases, while financing conditions influenced affordability. The rise in electric scooters and the mixed performance of electric three-wheelers point towards a market in transition, but the available figures do not establish whether demand is being matched by charging infrastructure, reliable power supply or consistent municipal support.
The evidence confirms three developments. India’s vehicle market recorded an unusually strong August; utility vehicles, scooters and commercial three-wheelers were important contributors; and alternative powertrains are gaining a more visible place in the sales mix. It also confirms that the comparison with a weak August 2025 base magnifies the year-on-year growth rate.
What remains uncertain is how much of the demand will persist after the festive season, how the sales mix will vary across cities and rural markets, and whether urban infrastructure will adapt to the expanding vehicle fleet. Automakers expect consumer demand to remain firm, supported by rural consumption, easier financing and the lower comparison base. The next useful evidence will be subsequent monthly sales data and more detailed information on geography, vehicle use, replacement demand and powertrain adoption.
