


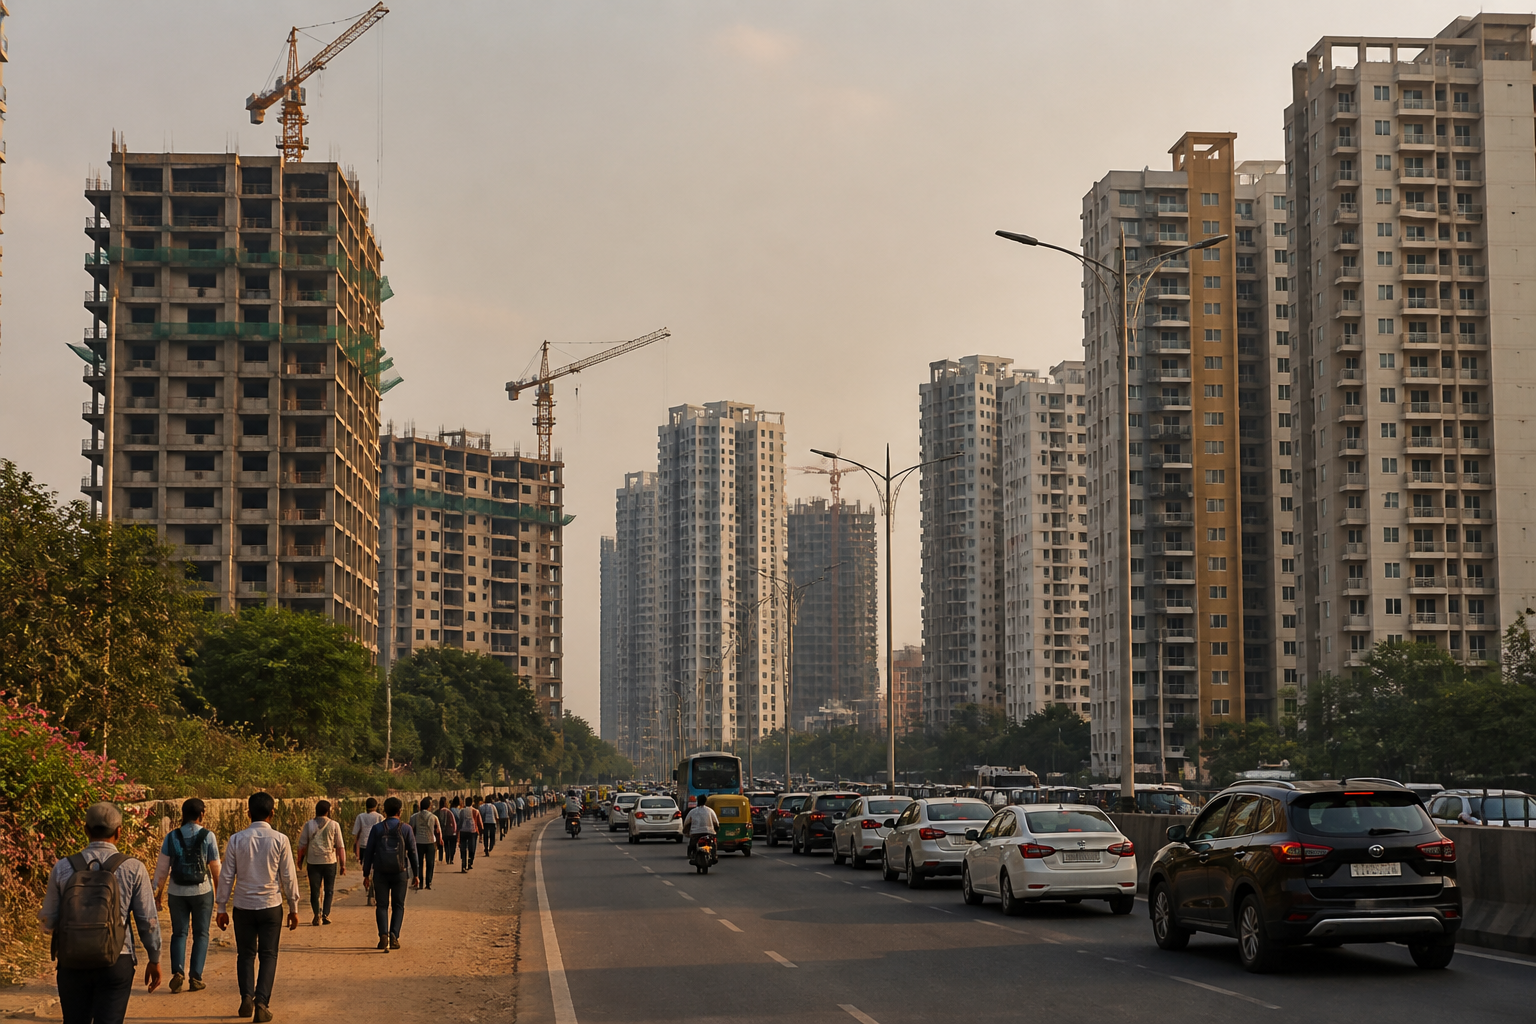
Bengaluru is adding homes, but the city’s housing market is increasingly producing the kind of supply that many households cannot afford. Data cited from Cushman & Wakefield and Anarock Research shows that new launches in the first half of 2026 were concentrated in high-end, luxury and upper-mid segments, while affordable housing accounted for only a small share of supply. The result is a housing market where the headline measure—more homes being built—does not necessarily translate into greater access for ordinary buyers.
Cushman & Wakefield’s figures show that high-end and luxury homes accounted for 68% of launches in Bengaluru during the first quarter of 2026. Affordable housing made up just 1% of launches in the same period. In the second quarter, high-end and luxury homes represented 58% of new supply, while the mid-segment accounted for 42%. No affordable launches were recorded in that classification during Q2.
Anarock Research reports a similar direction, although its definition of affordable housing is different. It classifies homes priced below Rs 40 lakh as affordable. On that basis, affordable units accounted for 5% of new supply in Q1 and 4% in Q2. The largest share of Q2 launches, 43%, fell within the Rs 80 lakh to Rs 1.5 crore price bracket.
The different thresholds used by the two consultancies mean their percentages cannot be treated as directly interchangeable. But the common signal is clear: Bengaluru’s new housing supply is moving upwards on the price ladder. This makes the city’s challenge more complicated than a simple shortage of homes. The issue is also whether the homes being added match the purchasing capacity of the households that need them.
That mismatch is emerging alongside a rise in residential prices. Cushman & Wakefield recorded a 6-7% year-on-year increase in Bengaluru’s capital values in the second quarter of 2026. Anarock’s data placed the average quoted residential rate at about Rs 9,450 per sq ft. Higher prices may reflect strong demand, but they also raise the entry barrier for buyers who are not participating in the city’s highest-paying segments.
The cost structure of housing helps explain why developers are concentrating on more expensive homes. Land is a major component of the final price, yet it is not included in standard construction-cost calculations. Anarock estimates that land values in Bengaluru increased by 60-120% between 2021 and the first half of 2026. The sharpest increases were recorded in established and infrastructure-led corridors, where demand and improved connectivity can raise land values even before a project is launched.
For a developer, higher land acquisition costs increase the amount that must be recovered through each unit. That can make lower-priced housing more difficult to deliver while maintaining project viability. The supplied data does not establish that land costs are the sole reason for the decline in affordable launches, but it shows why the economics of building at lower price points have become more challenging.
Construction costs have also risen. Across India’s top seven cities, including Bengaluru, Anarock Research estimates that the average cost of constructing a standard-plus residential project increased by 34%, from Rs 2,681 per sq ft in 2021 to Rs 3,604 per sq ft in 2025. Over the same period, average residential capital values rose by 59%, from Rs 5,826 to Rs 9,260 per sq ft.
The comparison is important because it shows that selling prices and construction expenses have not moved in isolation. Capital values increased faster than the reported construction cost over this period, but that difference cannot be treated as available room for affordable housing because the construction figures exclude land. Once land, financing, approvals, marketing and other project expenses are considered, the final price of a home is shaped by a much wider cost base.
The pressure on construction inputs has intensified as well. Anarock estimates that disruptions linked to the Middle East added another 8-10% to construction costs, with steel and fuel-linked logistics among the sharpest movers. Steel prices were estimated to be about 20% higher, while fuel and site logistics increased by 15-20%. Labour remained the largest single cost component, accounting for roughly 25-30% of project costs, although labour costs rose at a more moderate 5-6%.
These figures describe an industry operating under simultaneous land and input-cost pressure. They also help explain why the composition of supply matters as much as the total number of units launched. A market may continue to report strong construction activity while producing fewer homes in the price bands accessible to a large section of residents.
Bengaluru’s housing geography adds another layer to the problem. The report links the sharpest land-value increases to established, high-demand and infrastructure-led corridors. These are also the locations where employment, transport access and services can make housing especially desirable. When land prices rise in such corridors, households seeking proximity to jobs may face higher purchase prices or be pushed towards longer commutes and less connected locations.
The same pressure is visible in the rental market. Cushman & Wakefield reports that citywide rents rose 6-7% year-on-year in Q2 2026, driven by demand for rental apartments around prime office corridors. This weakens the assumption that renting automatically provides an affordable alternative to buying. For households unable to purchase, rising rents can consume more income while still leaving them dependent on locations close to employment and transport networks.
This creates a connected housing problem rather than two separate ones. Buyers face higher capital values and limited affordable new supply. Renters face increasing costs in the corridors where jobs are concentrated. The market is therefore under pressure at both ends: ownership is moving beyond the reach of more households, while rental demand is pushing up costs in employment-linked areas.
The data also points to an institutional question about how housing supply is planned and measured. Counting launches alone can suggest that a city is responding to demand. But the distribution of those launches by price band provides a different measure of access. Cushman & Wakefield and Anarock use different definitions, yet both indicate that affordable housing represents a small share of current additions. Without considering price composition, housing supply numbers can obscure the difference between overall growth and usable access.
There is no single policy instrument identified in the supplied material that explains or resolves this shift. The evidence instead shows how land markets, construction inputs, infrastructure-led demand and office-corridor rental pressure interact. Any assessment of Bengaluru’s housing response would therefore need to distinguish between the volume of homes delivered, their location, their price and the incomes of the households they are intended to serve.
The city’s housing challenge is consequently not just about building more. It is about whether the development model can produce homes at prices that correspond to the wider workforce, particularly in locations connected to jobs and services. The available data confirms that Bengaluru is adding substantial supply, but it also shows that affordable additions are limited, prices are rising and rental costs are increasing in prime corridors.
What remains uncertain from the supplied figures is how many households are being priced out, how affordable launches are distributed across the city and whether future projects will alter the current mix. Those are the indicators that will determine whether Bengaluru’s expanding housing market becomes more accessible or simply becomes larger at increasingly higher price points.
