


Subheadline: Bengaluru’s low position in the 2026 clean-air rankings points to a problem spread across traffic, industry, waste systems and household energy use.
Standfirst: Bengaluru has ranked 32nd among India’s million-plus cities in the 2026 Swachh Vayu Sarvekshan, placing it among the bottom 10 performers in the category. The city scored 152.6 points, well below the scores recorded by the top three cities: Lucknow at 198, Indore at 197 and Jabalpur at 195. The result is not being explained by a single pollution source. The assessment and expert comments cited in the report point instead to a combination of slow-moving traffic, inadequate road infrastructure, industrial emissions, waste-management failures and the continued use of wood and charcoal in some low-income settlements. The ranking therefore offers more than a position on a national table. It provides a view of how urban air quality is shaped by the interaction between transport, land use, household affordability, municipal services and enforcement. This analysis examines what the available evidence establishes, what it does not establish and why Bengaluru’s clean-air challenge remains institutionally fragmented.
Bengaluru air pollution has remained a persistent urban governance problem despite programmes intended to reduce emissions. At the 2026 Swachh Vayu Sarvekshan awards, organised by the Union Ministry of Environment, Forest and Climate Change, the city ranked 32nd in the million-plus category. Only seven cities were placed below it, according to the report. Bengaluru’s score was 152.6 points, compared with 198 for Lucknow, 197 for Indore and 195 for Jabalpur.
The ranking is based on the fifth Swachh Vayu Sarvekshan and forms part of the National Clean Air Programme framework described in the source material. Cities were assessed across multiple areas, including road dust, solid waste, vehicular emissions, industrial emissions, construction and demolition waste, diesel generator sets and emissions from commercial establishments. The framework also considers information, education and communication activities.
That breadth is important. It means the result is not a direct measurement of one pollutant or one day’s ambient air quality. It is an assessment of actions taken by cities across a range of pollution-control responsibilities. The process included city self-assessments, approval by State-level Monitoring Committees, evaluation by the Central Pollution Control Board and field verification by independent committees before the final selection of the best-performing cities.
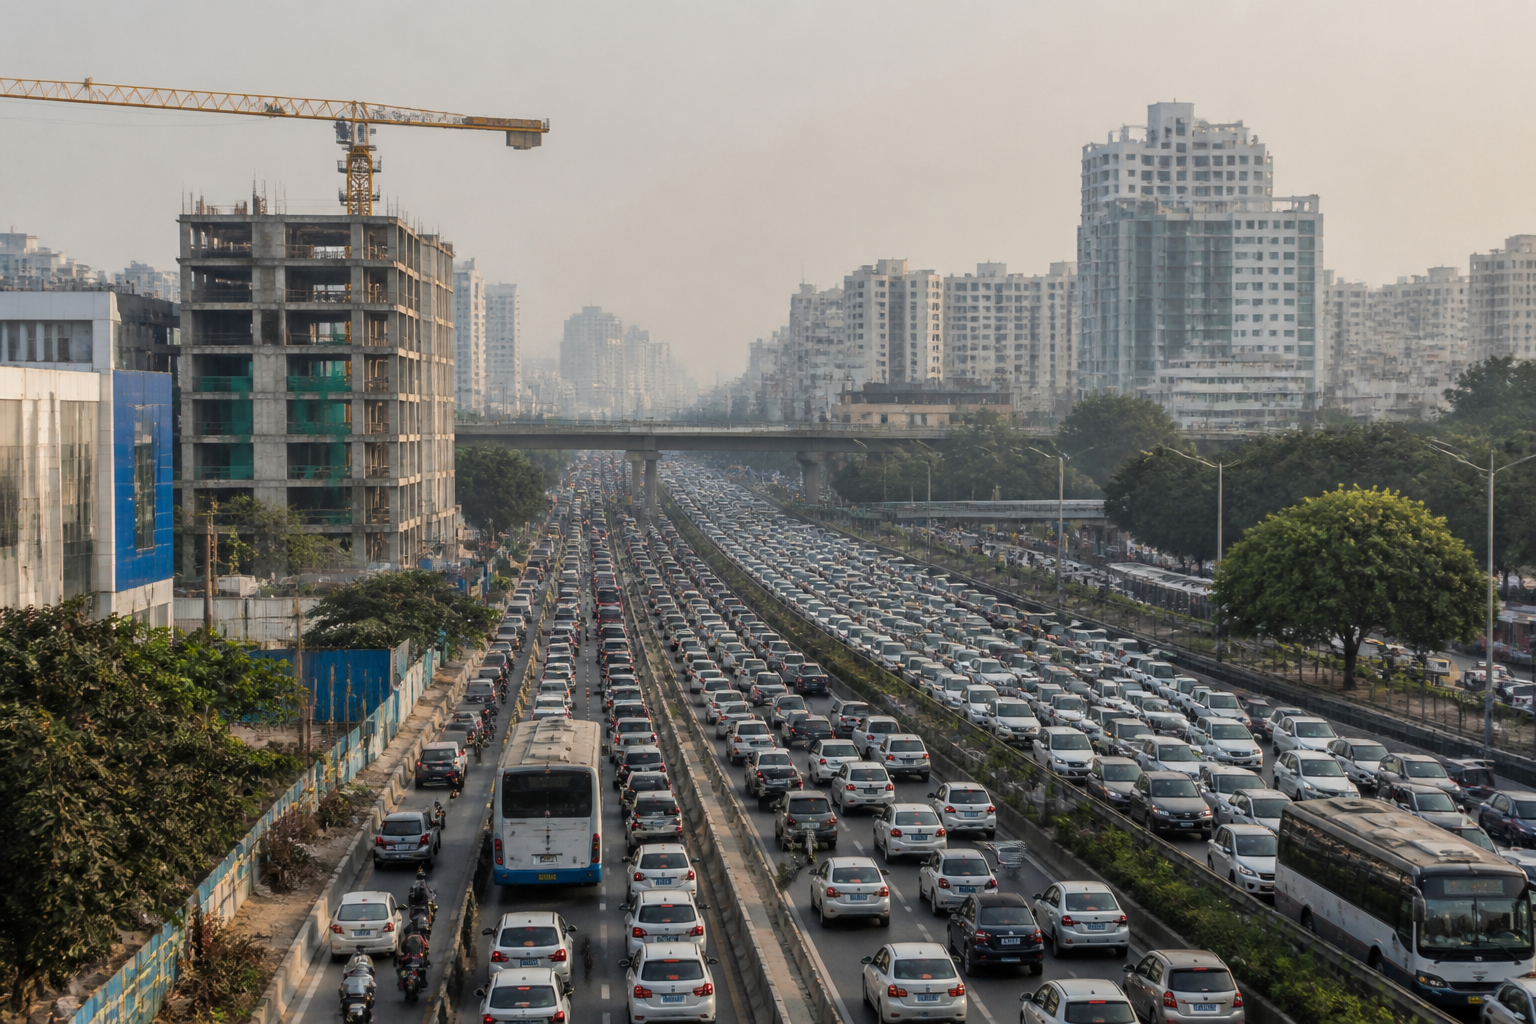
The evidence presented in the report suggests that Bengaluru’s weak performance is linked to the difficulty of coordinating these responsibilities. Traffic is the clearest example. Professor Gufran Beig, Chair at the National Institute of Advanced Studies, identified inadequate and improper traffic management as one of the main reasons for rising air pollution in the city. His explanation focuses not simply on the number of vehicles, but on the way they move.
Bengaluru is characterised by a mix of slow-moving, low-speed and high-speed traffic. According to Beig, this combination, together with congestion, increases emissions. Vehicles that spend longer periods in traffic continue producing emissions while the road network struggles to move them efficiently. The report also points to poor road infrastructure as a related concern, although it does not provide a separate estimate of the share of pollution attributable to transport or road conditions.
The distinction matters because traffic congestion is often treated primarily as a mobility problem. The evidence cited here presents it as an air-quality problem as well. When transport planning, road capacity, traffic management and emissions control are handled separately, the city can make progress in one area without reducing the overall pollution burden. A clean-fuel intervention, for example, cannot compensate for emissions produced by a traffic system that keeps vehicles moving slowly for long periods.
The report also identifies industrial emissions as a growing concern. Beig said emissions from small-scale industries were increasing and remained largely unaccounted for. The available material does not specify the number of such units, their locations, the pollutants involved or the extent of their contribution to Bengaluru’s overall air pollution. But the reference to unaccounted emissions exposes a central weakness in the city’s pollution-control architecture: what is not adequately inventoried is difficult to regulate, compare or reduce.
This gap is especially significant because the national assessment explicitly includes industrial emissions. Bengaluru’s score therefore reflects not only the presence of pollution sources but also the city’s ability to identify and act on them. The report does not establish whether the city lacks monitoring equipment, enforcement capacity, complete industrial records or coordinated institutional responsibility. It does establish that small-scale industrial emissions are being raised as an unresolved part of the problem.
Waste management is another part of the same system. Air-quality experts cited poor waste-management practices, while the assessment framework includes solid waste and construction and demolition waste. The source material does not provide city-level figures on waste generation, disposal, burning incidents or construction debris. It does, however, place waste management alongside traffic and industrial emissions as a factor in the city’s poor clean-air performance.
That combination shows why Bengaluru’s ranking cannot be addressed through a single-sector response. Waste systems affect what is burned, stored, transported and disposed of. Construction and demolition practices affect dust and material handling. Traffic systems affect vehicle emissions and road movement. Industrial regulation affects emissions that may not be visible in citywide indicators. Each area has different agencies, operators and enforcement arrangements, while the final air-quality outcome is experienced by the same residents.
The household-energy dimension adds an affordability question. The report says government data shows that clean-fuel schemes cover most households in the city’s shantytowns, creating an assumption that emissions from cooking fuels should have declined. Beig, however, said some residents were not using clean fuel because refilling cylinders was too expensive. As a result, some households had returned to burning wood and charcoal.
The distinction between access and sustained use is critical. A household may be covered by a clean-fuel scheme on paper but still rely on a more polluting fuel in practice if recurring costs are unaffordable. The source material does not quantify how many households have reverted to wood or charcoal, nor does it estimate the resulting emissions. It does point to a gap between programme coverage and actual use, showing that clean-energy policy cannot be evaluated only by the number of connections or beneficiaries recorded.
This is where Bengaluru’s air-quality challenge becomes a question of implementation rather than announcement. Clean-fuel schemes, the National Clean Air Programme and city-level actions may exist simultaneously, but their effectiveness depends on whether households can continue using the cleaner option, whether traffic systems reduce unnecessary idling, whether industries are recorded and monitored, and whether waste rules are implemented consistently.
The ranking framework itself attempts to capture that implementation environment. It evaluates not only emissions but also actions taken by cities and their communication efforts. The assessment process combines self-reporting, State-level review, central evaluation and field verification. That structure provides a basis for comparison, but the supplied material does not explain the weighting assigned to each category or how Bengaluru performed on individual indicators. Without those disaggregated results, the overall score can show that the city underperformed but cannot identify which intervention would produce the largest improvement.
The comparison with the leading cities is similarly useful but limited. Lucknow, Indore and Jabalpur recorded scores of 198, 197 and 195 respectively, while Bengaluru scored 152.6. These figures demonstrate a substantial gap within the million-plus category. They do not, by themselves, show that the better-ranked cities have lower ambient pollution, identical urban conditions or directly transferable policies. The assessment measures performance under its specified framework, not every dimension of lived air quality.
Bengaluru’s geographical location may help improve air quality, according to the expert cited in the report, but that advantage has not overcome emissions generated by congestion and other urban activities. The point is not that geography is irrelevant. It is that favourable conditions cannot substitute for effective management of pollution sources. The city’s ranking indicates that structural pressures are continuing to outweigh whatever environmental advantage its location may provide.
The larger urban question is therefore one of coordination and visibility. Traffic, industrial activity, household fuel use and waste management are often recorded through separate administrative systems. The clean-air assessment brings them into one performance framework, but the available result does not reveal whether Bengaluru’s institutions are responding to them as one connected problem. The concerns identified by experts suggest that they are not yet doing so effectively.
The evidence confirms that Bengaluru’s low ranking is associated with a broad set of urban systems rather than a single failure. It also confirms a gap between formal programme coverage and conditions on the ground, particularly in relation to household fuel use. What remains uncertain from the available material is the precise contribution of each source, the city’s performance on individual assessment categories and the operational steps planned after the 2026 ranking. Those details will determine whether the score becomes merely another annual comparison or a basis for more accountable action across transport, industry, waste and household energy.
