


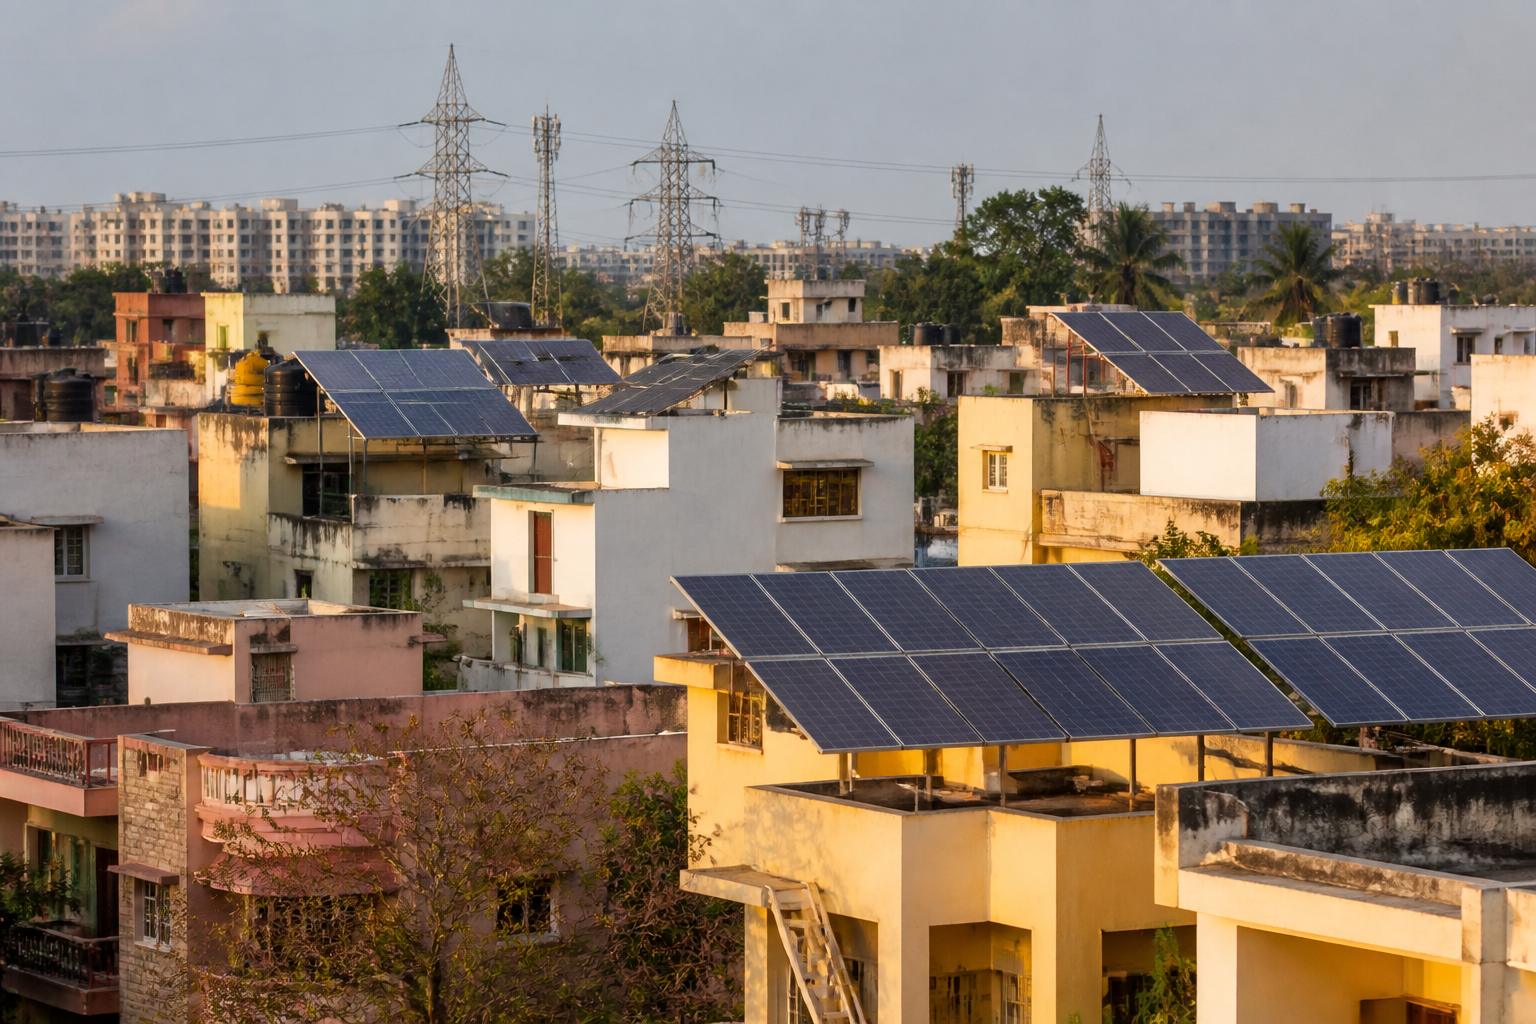
India’s PM Surya Ghar rooftop solar programme has crossed a significant installation threshold, but the latest state-level data also reveal the administrative and execution gap between household interest and completed systems. Uttar Pradesh and Maharashtra led residential rooftop solar installations in August, while applications nationally continued to exceed installations by a substantial margin.
The figures, compiled by JMK Research & Analytics from the PM Surya Ghar: Muft Bijli Yojana portal and reported by The Hindu BusinessLine, show a programme expanding rapidly across households. At one point in August, installed residential rooftop capacity under the scheme stood at 16,185.48 MW, covering 54,65,417 households. A later cumulative update cited in the report placed total installed capacity at 16,369 MW, with more than 46.44 lakh installations covering roughly 55.28 lakh households. The difference between the snapshots is not explained in the supplied material, but both figures point to a large and growing distributed-energy programme.
The more important signal is the relationship between demand and delivery. More than 4.48 lakh applications were received nationally in August, compared with over 3.57 lakh installations. At the cumulative level, the scheme had received more than 80.62 lakh applications against over 46.44 lakh installations. The numbers do not represent a simple failure-to-convert rate because applications and installations may relate to different periods, but they clearly show that the pipeline of interested households is larger than the number of completed systems.
That gap places implementation, rather than household awareness alone, at the centre of the programme’s next phase. Every application must move through processes that can include technical assessment, vendor engagement, installation, inspection, grid connection and subsidy release. The supplied report does not identify which of these stages accounts for the largest delay. It does, however, establish that the programme is processing installations at a much faster rate than it was several quarters earlier.
Uttar Pradesh recorded 228.95 MW of residential rooftop solar installations in August, the highest among the states cited. Maharashtra followed with 212.51 MW, while Andhra Pradesh added 192.39 MW. The state-level figures indicate that the programme is not being driven by one regional market alone. They also show that installation capacity and application volumes do not move in exactly the same order.
Uttar Pradesh received 89,901 applications in August and recorded 73,709 installations. Maharashtra received 79,679 applications and completed 61,110 installations. Andhra Pradesh received 22,557 applications and recorded 14,648 installations. In each of the three states, applications exceeded installations during the month. Uttar Pradesh’s higher installation capacity alongside its leading application and installation counts suggests a large market, while the supplied figures do not provide enough information to determine whether differences arise from system size, project mix, processing speed or other state-specific factors.
The national monthly installation figure also shows a short-term slowdown. Cumulative monthly residential rooftop capacity fell by roughly 11.6 per cent month on month, from 1,592 MW in July to around 1,407 MW in August. That decline sits alongside a much stronger longer-term trend: the pace of installation increased about 3.2 times over the last three quarters, rising from 5,038 installations per day in October 2025 to nearly 16,328 installations a day in July 2026.
These figures describe a programme growing quickly but not in a straight line. A one-month fall in installed capacity does not, by itself, establish a reversal. Nor does the rise in daily installations explain whether the programme is becoming more efficient at every stage. The available data support a narrower conclusion: implementation has accelerated substantially over the period cited, while monthly output can still fluctuate.
The scheme’s importance extends beyond the number of panels installed on urban and rural homes. Under PM Surya Ghar, households can obtain up to 300 units of free electricity each month, depending on system capacity, generation and consumption. Where applicable, surplus electricity can be exported to the distribution network. This creates a relationship between the household, the rooftop system and the distribution company that differs from the conventional model in which electricity flows only from a centralised generator to a consumer.
The report describes this as the emergence of the prosumer: a citizen who is both a consumer and producer of electricity. The concept is straightforward, but its practical operation depends on the quality of the connection between household systems and distribution networks. The supplied material does not provide state-level information on net-metering rules, export volumes, distribution-company readiness or the time taken to approve surplus-power connections. Those details will be important for understanding how much value households actually derive from generation beyond their own consumption.
The subsidy component is already substantial. More than ₹30,885 crore has been released under the scheme, according to the report. That figure establishes the scale of public financial support, but the supplied data do not break it down by state, household category, system size or average subsidy per installation. Without that information, it is not possible to assess whether subsidy disbursement is keeping pace with installations or whether some regions or household groups are receiving a disproportionate share of support.
The programme is also part of a wider expansion of India’s power-generation capacity. The country added 35.13 GW of net new capacity in the first half of 2026, representing 54 per cent year-on-year growth, according to figures attributed to the Institute for Energy Economics and Financial Analysis. Renewables accounted for more than 87 per cent of those additions, or 30.58 GW, while solar alone contributed 26.34 GW.
Utility-scale additions and household rooftop systems operate at different scales and through different institutional arrangements. Large projects add generation capacity to the power system, while rooftop installations distribute generation across individual properties and connect it to local networks. The figures in the supplied material do not permit a direct comparison of their costs, reliability or contribution to peak demand. They do show that rooftop solar is advancing alongside a broader national shift towards new renewable capacity.
For cities, the rooftop model introduces energy infrastructure into the existing building stock. Homes become sites of electricity generation, and distribution networks must accommodate more two-way flows. The success of the programme therefore depends not only on the number of applications or the aggregate megawatts recorded on a portal. It also depends on whether households can complete installation, receive the promised subsidy, use the generated electricity and export surplus power when the system permits it.
The August figures point to three simultaneous realities. First, the programme has achieved substantial scale, with installed residential capacity above 16,000 MW in the reported updates. Second, demand remains ahead of completed installations, with applications exceeding installations both nationally and in the leading states. Third, the pace of execution has risen sharply over the longer period cited, even as monthly capacity declined between July and August.
What remains uncertain is where the conversion gap is concentrated and how evenly the benefits are distributed. The available material does not identify pending applications by state, installation timelines, rejection rates, household electricity savings or the performance of connected systems. It also does not explain the difference between the two cumulative capacity and household figures cited in the report. These are not minor details: they determine whether headline growth translates into predictable household benefits and reliable distributed generation.
The next phase of PM Surya Ghar will therefore be measured by more than cumulative capacity. The programme’s public record will need to show how applications move through the pipeline, how quickly systems are connected, how subsidies reach households and how distribution networks manage prosumers. The evidence currently confirms rapid expansion and strong demand. It also shows that the central challenge is shifting from attracting applicants to completing installations and integrating them into the electricity system.
