


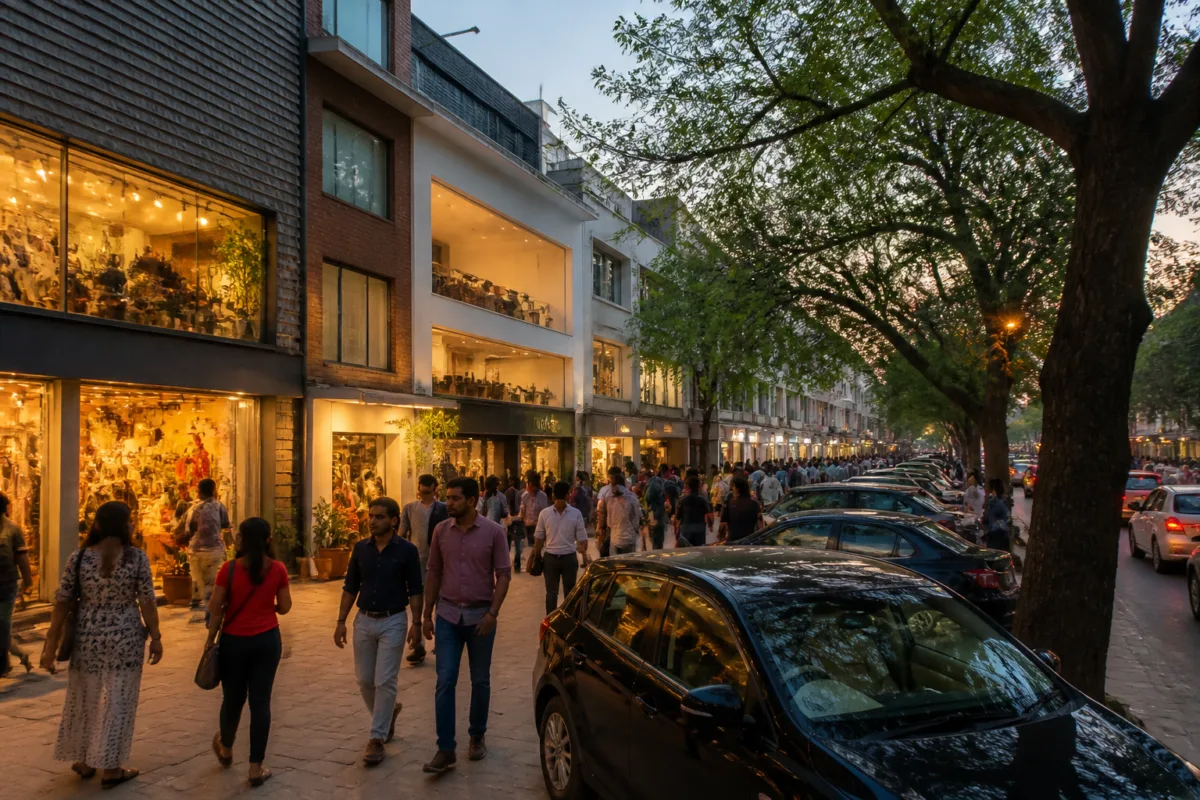
Khan Market has entered the world’s 25 most expensive retail markets after its annual headline rent rose 14% to $238 per square foot, according to Cushman & Wakefield’s Main Streets Across the World 2026 report. The Delhi market ranks 24th globally and is the only Indian retail destination included among the 147 markets assessed.
The reported rent translates to approximately Rs 1,875 per square foot a month. On that basis, a 1,000-square-foot shop in Khan Market would carry an estimated monthly rent of around Rs 18.75 lakh, before other occupancy and operating costs. The figures underline the premium being commanded by one of Delhi’s most established high-street retail locations.
The report measures headline rents, which indicate the top asking levels for prime retail space rather than the average rent across every shop in the market. The increase places Khan Market in a global group of high-value shopping streets where limited space and strong commercial demand support elevated occupancy costs.
New York’s Upper Fifth Avenue was ranked the world’s most expensive retail street, with annual rent rising 35% to $2,700 per square foot. It moved up from third place in 2025. London’s New Bond Street ranked second at $2,230 per square foot annually, while Milan’s Via Montenapoleone was third at $2,160.
The comparison shows that Khan Market’s rents remain well below the leading global streets in dollar terms, but its presence in the top 25 reflects the scale of India’s prime retail market. Within the Asia-Pacific region, Gurugram’s Galleria Market and Delhi’s Connaught Place were also listed among the leading retail streets, although the supplied report does not provide their individual rankings or rents.
Across the world’s major retail markets, rents increased by an average of 3% during the year, compared with 4.3% in 2025. Khan Market’s 14% increase therefore outpaced the global average reported by Cushman & Wakefield. The report provides the latest comparative benchmark for the market; it does not specify the number of leases behind the Delhi figure or identify how the increase was distributed across individual properties.