


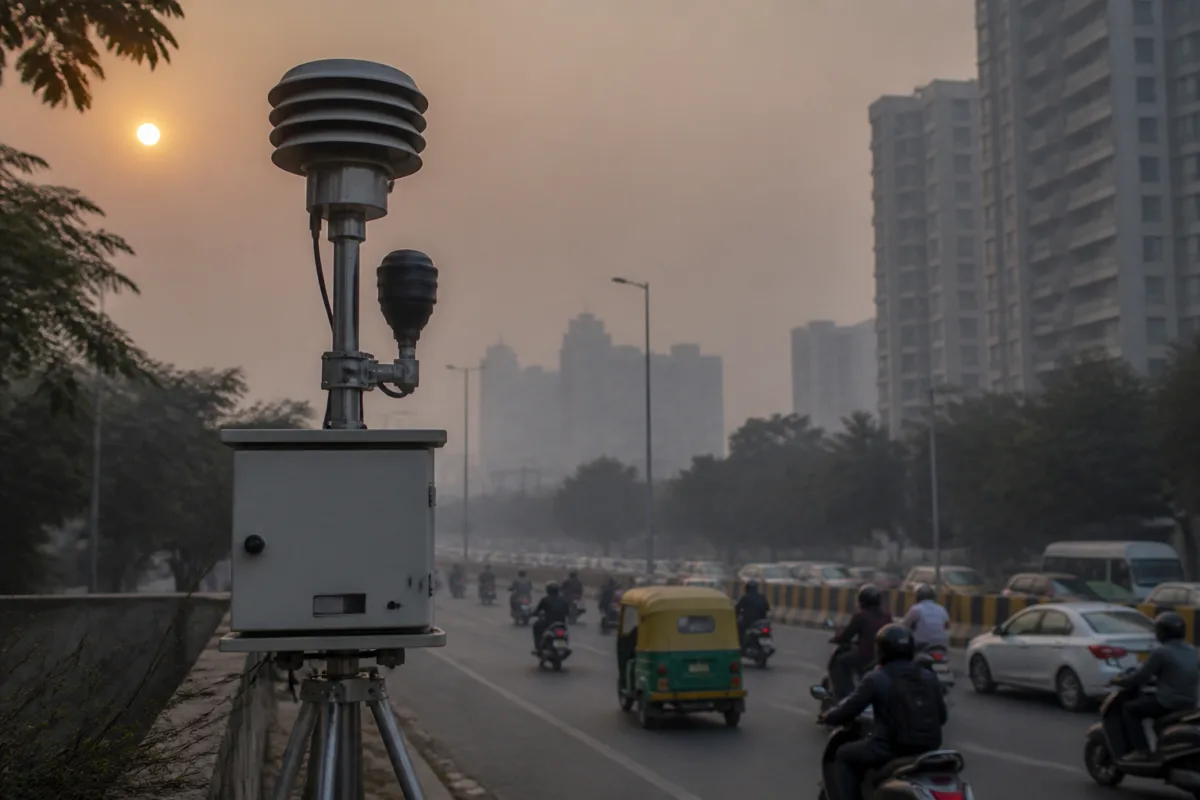
Delhi’s newly released PM2.5 data from Diwali night reveals a pollution episode far more severe at several monitoring stations than the previously available official record suggested. The Delhi Pollution Control Committee released hourly readings that had been missing from the Central Pollution Control Board’s record, showing PM2.5 concentrations as high as 3,744 micrograms per cubic metre—more than 60 times the national standard of 60 micrograms per cubic metre.
The disclosure changes the understanding of what happened during the night of 8 November and the early hours of 9 November. It also raises a larger urban question: when the public depends on a single headline number such as the Air Quality Index, what happens when the underlying station-level data is incomplete or delayed?
According to the report, the missing hourly data was released by the DPCC at around 8 pm on Monday. The highest reading was recorded at Mundka at 2 am, when PM2.5 reached 3,744 micrograms per cubic metre. Jawaharlal Nehru University recorded 3,023 micrograms per cubic metre at 4 am, while NSUT’s West Campus recorded 3,008 at 5 am. Other extreme readings included 2,908 at Mandir Marg, 2,808 at Nehru Nagar and 2,721 at Wazirpur.
These were not isolated readings. PM2.5 crossed 2,000 micrograms per cubic metre at 11 DPCC stations, according to the report. The DPCC data also showed that all 125 station-hours missing from the CPCB record had readings above 1,000 micrograms per cubic metre. A station-hour refers to one monitoring station’s reading for one specific hour, making the gap important not merely because of one absent number but because a large block of time-series data was unavailable during the most critical period of the pollution episode.
The distinction between the two datasets is significant for public communication. The CPCB’s highest figure in the previously available record for that night was 1,000 micrograms per cubic metre, while the later DPCC readings were substantially higher. The report says that where readings from both agencies had already been released, the figures were the same. This suggests that the issue described was concentrated in the missing portions of the record rather than an across-the-board disagreement between the two agencies.
The missing information also affected the apparent extent of the monitoring gap. At 1 am, the CPCB record did not contain PM2.5 data for 36 of Delhi’s 59 stations, according to the report. In a city where pollution varies by location, weather, local emissions and the timing of firecracker activity, missing readings can make it more difficult to understand how widely an extreme episode spread.
This is where the episode moves beyond a technical data-release story. Delhi’s air-quality system is designed to convert readings from monitoring stations into a public-facing indicator. That indicator is useful because it simplifies complex pollution conditions into a scale that residents, authorities and news organisations can quickly interpret. But the simplification creates a dependency: the reliability of the final number depends on the quality, continuity and transparency of the measurements that feed into it.
The report says that incorporating the newly released readings would place Delhi’s AQI at approximately 384, compared with 370 reported earlier by the CPCB. The average AQI was 376 on Sunday and 371 on Monday morning, according to the same report. The difference between 384 and 370 may appear limited when viewed only as an AQI change, especially because the index reaches its upper limit at 500. Yet the station-level PM2.5 readings show that the apparent stability of the citywide number can coexist with extremely high concentrations at particular locations and times.
The source reports that PM2.5 concentrations above approximately 420 micrograms per cubic metre already push the AQI to the maximum value of 500. Once the index reaches that ceiling, a reading of 1,000 and a reading of 3,000 cannot be distinguished through the headline index alone. The AQI therefore communicates that conditions are extremely poor, but it does not fully communicate how far beyond the upper threshold some local readings have travelled.
This creates a measurement problem for urban governance. A capped index is easier for the public to understand, but it can conceal the scale of variation during extreme pollution events. Residents in areas near stations recording the highest concentrations may be experiencing conditions materially worse than the citywide average suggests. Without timely station-level data, that variation is difficult to see when the main public conversation centres on one aggregated number.
The episode also highlights the institutional division between pollution monitoring and pollution control. The DPCC released the missing readings, while the CPCB record had earlier been used to report the city’s air quality. The report does not establish why the station-hour data was absent from the CPCB record, but it says a government official attributed the problem to technical difficulties. The same official said that air-quality monitors were now providing hourly readings and that all 43 stations were supplying data.
That explanation is important, but it leaves several operational questions unresolved in the supplied material. It is not clear which monitoring stations experienced the technical problem, when the interruption began, how the missing readings were reconstructed or transferred, or what formal protocol exists for publishing corrected data during a public-health emergency. These details determine whether the episode was a temporary transmission failure, a data-processing problem or a wider weakness in the monitoring chain.
The number of stations cited in the report also illustrates why the data architecture matters. The report refers to 59 stations in the CPCB record at one point, while the government official said all 43 stations were providing data after the issue was addressed. The supplied report does not explain the relationship between these station counts or whether they refer to different networks, reporting systems or subsets of monitors. That distinction should be clarified in any full technical review of the episode.
The political response has added another layer to the data dispute. Aam Aadmi Party Delhi unit chief Saurabh Bharadwaj accused the government of manipulating pollution data and alleged that water was being sprayed at monitoring stations to reduce recorded AQI levels. Those allegations are attributed to him in the report and are not independently established in the supplied material. They therefore cannot be treated as evidence of manipulation. However, they demonstrate how gaps in environmental data can quickly become a governance and public-trust problem.
For residents, the immediate consequence of missing data is uncertainty. People use pollution readings to decide whether to travel, exercise outdoors, send children outside or take additional precautions. During a festival-linked pollution spike, the timing of readings is especially important because concentrations can change sharply over a few hours. Delayed publication means that information may become available only after the period in which it would have been most useful for decisions.
The episode also shows the limits of treating air pollution as a single citywide condition. Delhi’s average AQI provides a broad picture, but the reported values differed considerably across Mundka, JNU, NSUT West Campus, Mandir Marg, Nehru Nagar and Wazirpur. The locations span different urban contexts, and the spread of readings indicates that residents’ exposure cannot be inferred perfectly from one aggregate number. The supplied report does not provide meteorological or emissions data, so it cannot establish why individual stations recorded different peaks.
What the available evidence confirms is narrower but still significant. Delhi experienced extremely high PM2.5 readings during the Diwali-night episode; a substantial set of station-hours was missing from the earlier CPCB record; the DPCC later released those readings; and the newly available data showed much higher concentrations at several stations than the previously published maximum. The report also says the monitoring system was subsequently providing hourly data from all 43 stations cited by the official.
What remains uncertain is equally important. The supplied material does not establish the precise cause of the missing data, the process through which it was restored, whether the technical problem affected public advisories, or whether the corrected readings will be incorporated into a permanent official record. It also does not independently verify the political allegation that monitoring stations were deliberately influenced.
The larger lesson for Delhi’s pollution governance is that measurement is not a supporting detail of environmental policy; it is part of the public infrastructure through which the crisis is understood. A citywide index can summarise conditions, but transparent hourly station-level reporting is necessary to show where exposure is concentrated, when peaks occur and whether the official record is complete. The next test for the agencies will be whether the explanation for the missing data, the corrected dataset and the monitoring system’s future safeguards are made clear before the next extreme pollution episode.