


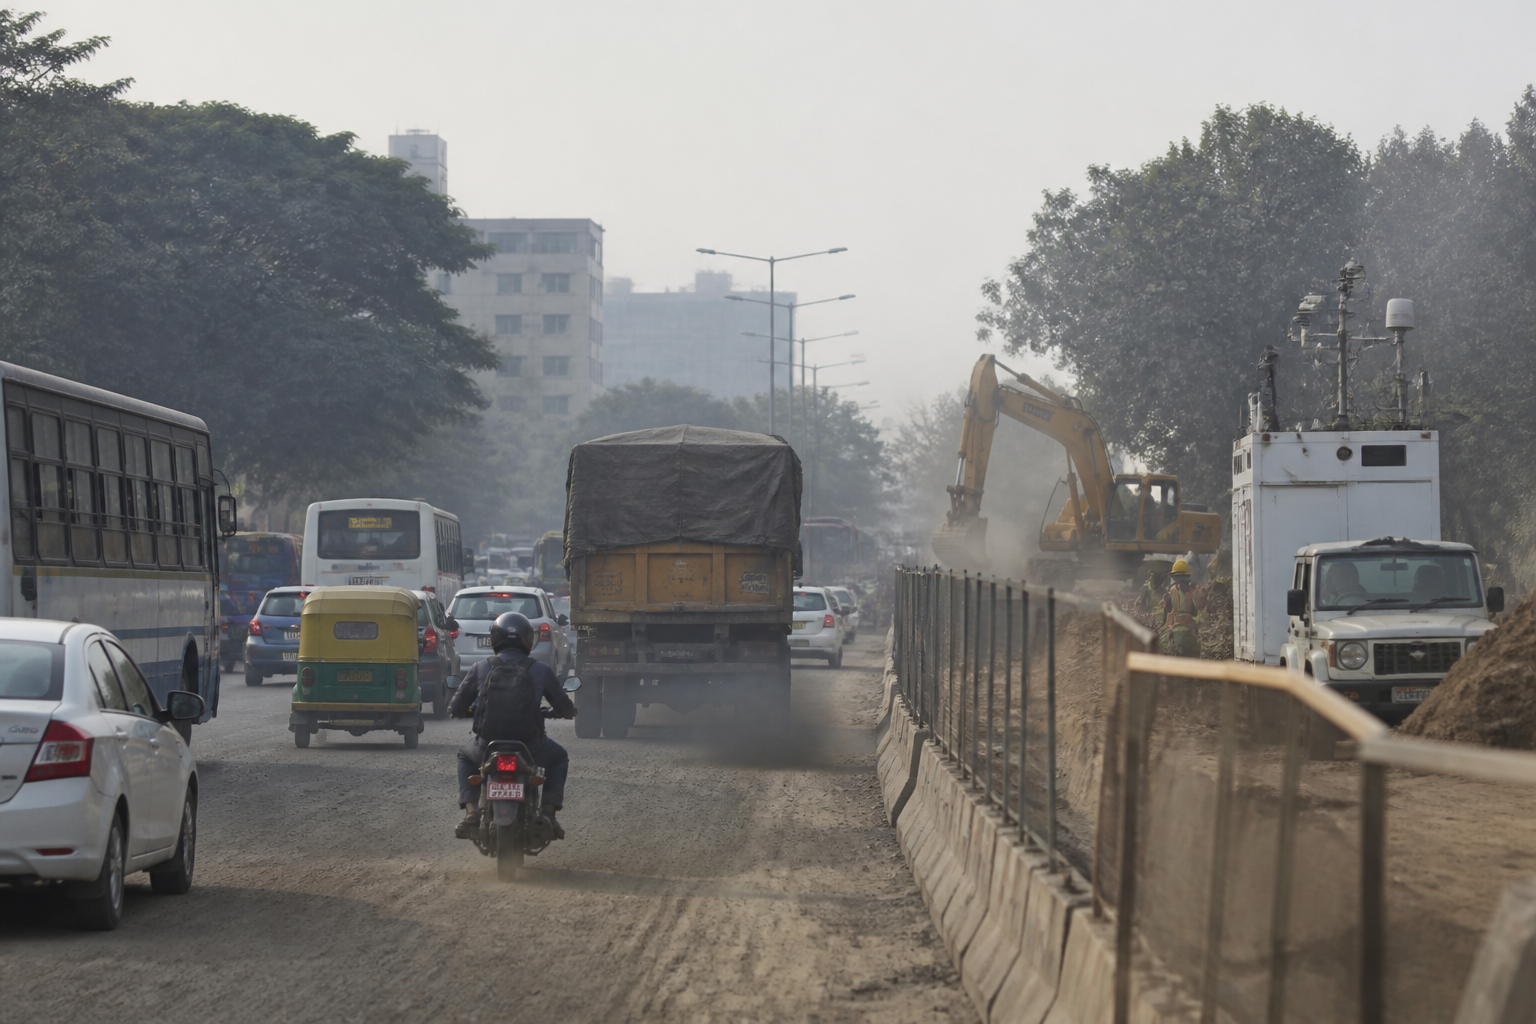
Bengaluru’s air quality score improved in the 2026 national clean-air survey, but the city’s 32nd-place ranking shows that monitoring and spending have not yet produced a decisive improvement in the urban systems that generate pollution. The result places Bengaluru behind Delhi, Mumbai and Hyderabad among cities with populations above one million, despite hundreds of crores being allocated under the National Clean Air Programme.
The survey, released by the Union Ministry of Environment, Forest and Climate Change, gives Bengaluru 152.6 points in the category for cities with more than one million residents. The city had scored 145.1 points and ranked 36th in the 2025 survey. The year-on-year improvement is therefore real, but it has not been large enough to move Bengaluru into the higher-performing group. Lucknow led the list with 198 points, followed by Indore with 197.
The ranking is important because it places Bengaluru’s air problem within a wider urban comparison. Delhi scored 172 points and ranked 21st, Mumbai scored 160.8 and ranked 28th, while Hyderabad ranked 19th with 174.2 points. Chennai was placed 35th with 147.7 points. Bengaluru’s position is therefore not simply a reflection of its reputation as a relatively less polluted metropolitan city; it is also a measure of how effectively its institutions are controlling everyday sources of particulate pollution.
The data on particulate matter shows a similar pattern of partial progress. Bengaluru’s annual PM10 concentration fell from 92 in 2017-18 to 78 in 2025-26, according to the report cited by Vijay Karnataka. PM10 refers to particles with a diameter of 10 micrometres or less. PM2.5, consisting of even smaller particles, is also identified as a major pollutant. These particles can reduce lung function and have serious effects on people with asthma, respiratory conditions and heart disease.
The decline in PM10 indicates that air quality has improved compared with the 2017-18 baseline. But the survey result suggests that improvement in the measured concentration is not the same as effective control of the city’s pollution sources. Bengaluru’s annual average remains tied to activities that are visible across the urban landscape: construction, road deterioration, vehicle emissions and unmanaged solid waste.
This is where the city’s clean-air challenge becomes an administrative issue rather than only a monitoring issue. Bengaluru has 11 continuous ambient air-quality monitoring stations, 13 manually operated monitoring stations and six mobile smoke-monitoring vehicles. This provides the city with a substantial measurement network. Yet the presence of monitoring infrastructure does not automatically ensure compliance at construction sites, on roads or around waste facilities.
The report says Bengaluru received Rs 541.1 crore under the National Clean Air Programme from 2019-20 onwards, of which Rs 440.23 crore had been spent. The programme aims to reduce PM10 levels by 40 per cent. The spending figure is significant, but the survey raises a basic institutional question: whether expenditure is being converted into source-level action with sufficient consistency.
For a city expanding through constant construction, dust control cannot be treated as a temporary site-management task. Demolition and construction rules require protective sheet barriers around sites and covered transportation of construction debris. The report says these requirements are not being enforced strictly. That creates a gap between the existence of regulation and its daily application on streets where residents, pedestrians and workers are exposed to dust.
Road conditions add another layer to the problem. Deteriorating roads can generate and redistribute dust through vehicle movement, while roadwork and infrastructure construction can create additional particulate emissions. When several projects operate across a metropolitan area at the same time, the cumulative effect is experienced at street level even if individual construction sites meet requirements intermittently.
Transport is the second major pressure point identified in the report. Older diesel vehicles continue to operate, and the article calls for stricter action against vehicles emitting excessive smoke. It also argues that electric-vehicle adoption must be encouraged alongside more citizen-friendly public transport. The connection is straightforward: vehicle technology affects emissions, but the availability and attractiveness of public transport influence how many people depend on private vehicles in the first place.
Waste management creates a similar enforcement problem. Open burning of solid waste, including waste near landfill sites, is identified as an ongoing source of pollution. The report says burning of garbage continues in the city and that restrictions are not being implemented firmly enough. This is not only an environmental failure; it reflects the consequences of gaps in collection, segregation, transportation and disposal systems.
The comparison with Lucknow and Indore is useful because it shifts attention away from citywide rankings alone and towards the design of interventions. Lucknow is reported to be using 1,093 electric vehicles for waste collection. Indore has focused on developing forests and green corridors, moving public transport towards electric and compressed natural gas vehicles, and implementing integrated waste management. The examples cited in the report suggest that better performance depends on controlling the source of pollution rather than relying only on road dust suppression or measurement.
Bengaluru’s ward-level results underline the unevenness of the challenge. Koramangala, in the category of wards with more than 30,000 residents, ranked 151st. The available material does not provide a detailed ward-wise breakdown of the causes behind that position, but the result indicates that citywide averages can conceal neighbourhood-level exposure. Construction intensity, traffic volumes, road conditions and waste practices can vary sharply between wards, making local enforcement important.
The clean-air programme therefore operates across several institutional responsibilities. The Union ministry provides the programme framework and funding. State and city-level agencies are responsible for monitoring, enforcement, transport management, construction compliance and waste systems. The survey’s numbers show that Bengaluru has made progress in measured PM10 levels, but its ranking indicates that the wider system remains less effective than those of several comparable cities.
The difference between Bengaluru and the leading cities is also visible in the type of action described. Lucknow and Indore are presented as cities addressing collection fleets, public transport, green infrastructure and waste management together. Bengaluru’s identified weaknesses are similarly interconnected. Old diesel vehicles, open waste burning, construction dust and damaged roads are not separate problems when they affect the same neighbourhoods and residents.
The city’s monitoring network can identify pollution patterns, but the next administrative step is to connect those measurements to enforcement. A reading near a construction corridor should lead to compliance checks; smoke-monitoring data should support action against high-emission vehicles; repeated reports of waste burning should trigger investigation of collection and disposal arrangements. The supplied report does not establish how consistently these links currently operate, which is itself an important limitation in assessing the effectiveness of the spending.
What the 2026 survey confirms is a mixed picture. Bengaluru’s score has improved, and its PM10 concentration is lower than in 2017-18. At the same time, the city remains 32nd among million-plus cities, with a lower score than Delhi and Mumbai, and continues to face persistent pollution from construction, transport and waste. The next test will not be another round of announcements or monitoring alone, but whether the agencies responsible for these sources can demonstrate stricter, sustained implementation of existing controls.
