


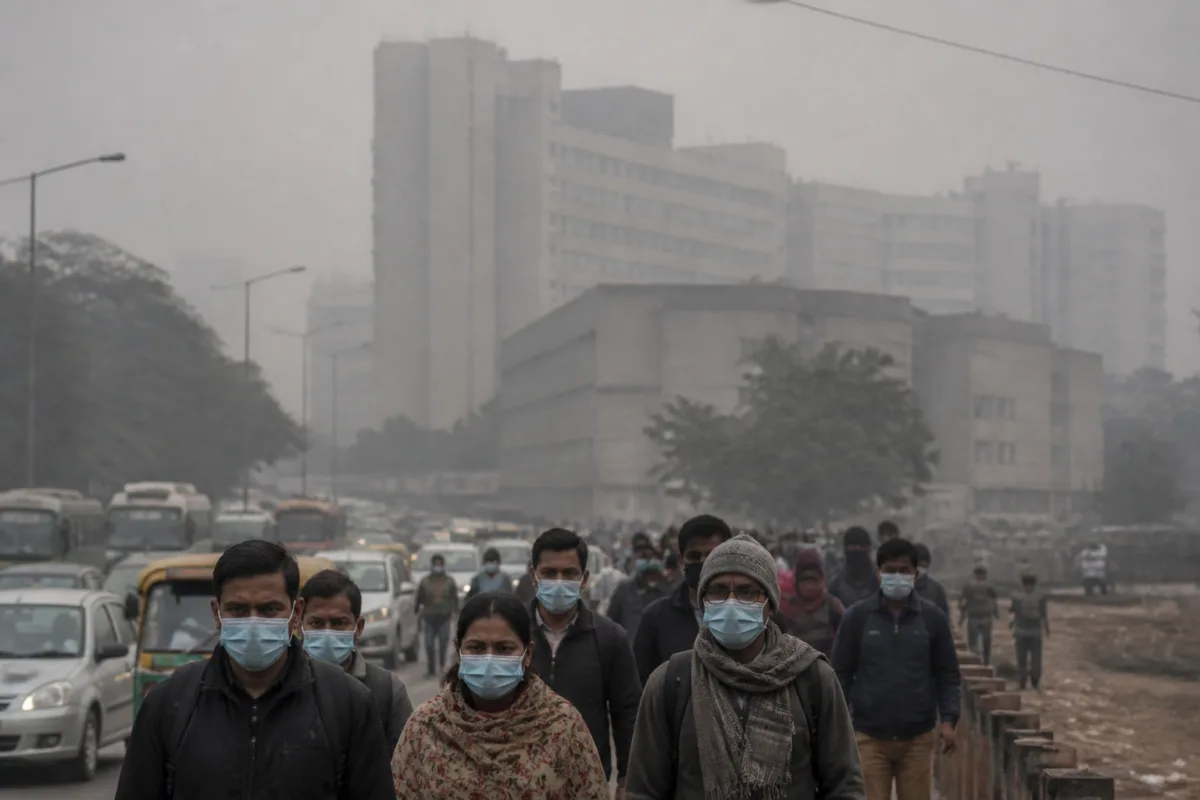
Air pollution claims recorded by Policybazaar increased 4.34 times between FY23 and FY26, while the total amount paid out rose 4.5 times. The figures point to a less visible cost of polluted cities: the burden is not limited to air-quality readings or hospital admissions, but is also appearing in insurance claims, household finances and the working lives of urban residents.
The data, reported by the insurance aggregator, shows that pollution-associated claims rose 67% in FY24, 70% in FY25 and 53% in FY26. The supplied report does not define the precise medical or underwriting criteria used to classify a claim as pollution-associated, nor does it establish that the figures represent the entire Indian health insurance market. They nevertheless provide a window into the way respiratory and cardiovascular illness is being recorded within one large insurance data set.
That distinction matters. A rise in claims can reflect several overlapping factors, including greater awareness, increased insurance ownership, improved access to treatment, higher medical costs and a genuine increase in pollution-linked illness. The available data cannot isolate the contribution of each factor. What it does show is that the financial consequences associated with pollution have risen substantially within Policybazaar’s reported portfolio over three financial years.
## The health burden extends beyond respiratory disease
The largest share of pollution-associated claims in the data came from cardiovascular conditions, at 43.5%. Other respiratory infections accounted for 35%, followed by pneumonia at 11.2% and bronchitis at 6%. The distribution complicates the familiar public discussion in which polluted air is primarily linked to coughing, asthma or other respiratory symptoms.
Cardiovascular claims forming the largest category does not, by itself, prove a direct causal relationship between air pollution and every individual claim. The report presents the conditions as associated with pollution, while the underlying data and methodology are not provided in the supplied material. But the pattern does underline the breadth of the health burden being captured: the claims are not confined to one organ system or one age group.
Rohan Goel, business head for health insurance at Policybazaar, said the company’s data showed that rising pollution levels were increasingly reflected in India’s healthcare burden, with pollution-associated claims surging 4.3 times. His statement links the trend to worsening pollution, but the report does not provide a city-by-city pollution series or clinical analysis that would independently test that relationship.
The financial data is clearer. The total claim amount rose 4.5 times between FY23 and FY26, and the average claim amount remained above FY23 levels. This means the issue is not only that more claims were recorded. The aggregate cost attached to those claims also expanded, although the supplied report does not provide the average claim figures, the number of policyholders covered or the reasons for changes in treatment costs.
## Working-age residents carry the largest recorded share
People aged 31 to 55 accounted for 59% of the pollution-associated claims, according to Policybazaar. Senior citizens aged 55 and above contributed another 31%. Young adults aged 21 to 30 accounted for 6.7%, while children below 20 made up 3.7%.
The age distribution places working-age residents at the centre of the reported trend. This is significant for cities because the same group is often most exposed to daily commuting, workplace travel and prolonged time outdoors. However, the data does not establish whether exposure occurs primarily at home, during travel, at work or through a combination of these settings. Nor does it indicate whether the age shares reflect the age profile of Policybazaar’s insured customers.
The 59% share should therefore be read as a signal about the claims recorded in the company’s data, not as a direct estimate of the proportion of all working professionals affected by pollution. Even with that limitation, the concentration is important for urban policy: pollution is not only a seasonal inconvenience for vulnerable groups but a potential health and financial issue for people in the middle of their working lives.
## Delhi leads, but the problem is not confined to the capital
Delhi recorded the highest number of pollution-associated health insurance claims among the cities listed in the report. Pune, Bengaluru, Mumbai and Hyderabad followed. The report also states that Tier-2 and Tier-3 cities together accounted for 55% of the claims.
This is one of the most consequential findings because it challenges a capital-centric understanding of urban air pollution. Delhi’s position is consistent with its long-standing prominence in public debate over poor air quality, but the combined share attributed to smaller cities indicates that the insurance burden extends beyond the largest metropolitan centres.
The figure does not show that Tier-2 and Tier-3 cities have pollution levels identical to Delhi, nor does it rank them by exposure or disease risk. Claims can also be influenced by population, insurance penetration, hospital availability, local treatment-seeking behaviour and the composition of Policybazaar’s customer base. Still, the data suggests that urban health planning cannot be limited to the most visible pollution hotspots.
For municipal administrations, the practical challenge is that pollution sources, health services and insurance systems operate across different institutional boundaries. Air-quality management may involve municipal bodies, state pollution control boards, transport agencies and regional authorities. Medical treatment is delivered through public and private health systems, while the financial consequences are recorded by insurers and aggregators. A claims trend can reveal pressure in the health system, but no single institution controls all the factors behind it.
## The seasonal pattern exposes a predictable governance failure
Nearly 56% of all annual pollution-associated claims in FY26 were recorded between October and March, the period when air pollution typically worsens across several parts of India. The concentration is important because it indicates that the burden follows a recurring seasonal pattern rather than appearing randomly throughout the year.
A predictable seasonal increase creates the possibility of earlier preparation, but the supplied data does not show whether hospitals, insurers or civic authorities changed their readiness during these months. It also does not identify the pollution sources responsible for the reported claims. The evidence supports a seasonal association, not a conclusion about which specific emissions, weather conditions or urban activities caused the increase.
The timing nevertheless exposes a familiar weakness in urban governance: recurring hazards are often treated as episodic emergencies. When a large share of claims arrives within a defined six-month period, the consequences extend beyond air-quality alerts. They can affect hospital demand, household spending, employee attendance and the ability of families to absorb unexpected medical costs.
Policybazaar’s data showed that 48% of consumers living in highly polluted cities opted for higher health insurance coverage. This suggests that households in polluted urban environments may be responding financially to perceived health risk. It does not establish whether higher coverage is affordable for lower-income households, whether it provides adequate protection against pollution-related illness or whether people without insurance are experiencing a greater burden outside the data set.
## Insurance is recording the cost, not solving the cause
The report’s most important institutional distinction is between financial protection and pollution control. Health insurance can help cover treatment expenses after illness occurs, but it does not reduce exposure or remove the urban conditions that produce poor air. Higher coverage may limit the immediate financial shock for some households while leaving the environmental and public-health drivers untouched.
The reported rise in claims therefore sits at the intersection of three systems: urban environmental regulation, healthcare delivery and household risk management. Pollution-control agencies address emissions and air quality; hospitals and clinicians manage illness; insurers process financial claims. The data comes from the third system, but its implications reach into the first two.
The evidence also raises a measurement question. If insurers classify claims associated with pollution using consistent definitions over time, their data could become a useful supplementary indicator of urban health stress. But the supplied report does not explain the classification method, claims base, policy mix, geographic denominators or whether the same customers were tracked across FY23 and FY26. Without those details, the figures show the direction and scale of change in the reported portfolio but cannot provide a complete national estimate.
The broader urban question is whether cities measure pollution only as an environmental condition or also as a recurring cost imposed on residents. Air-quality monitoring captures concentrations in the atmosphere. Hospital records capture illness. Insurance claims capture a portion of the financial response. Together, these systems could provide a fuller picture, but the current report gives only one part of that chain.
Policybazaar’s figures confirm a steep increase in pollution-associated claims and claim payouts within its data between FY23 and FY26. They also show that the recorded burden is concentrated among people aged 31 to 55, extends beyond major metros, and peaks during the October-to-March period. What remains uncertain is how much of the increase reflects worsening exposure, changes in insurance coverage, medical utilisation or classification practices. Those limitations make the data a significant warning signal, but not a standalone measure of India’s total pollution-related health burden.