


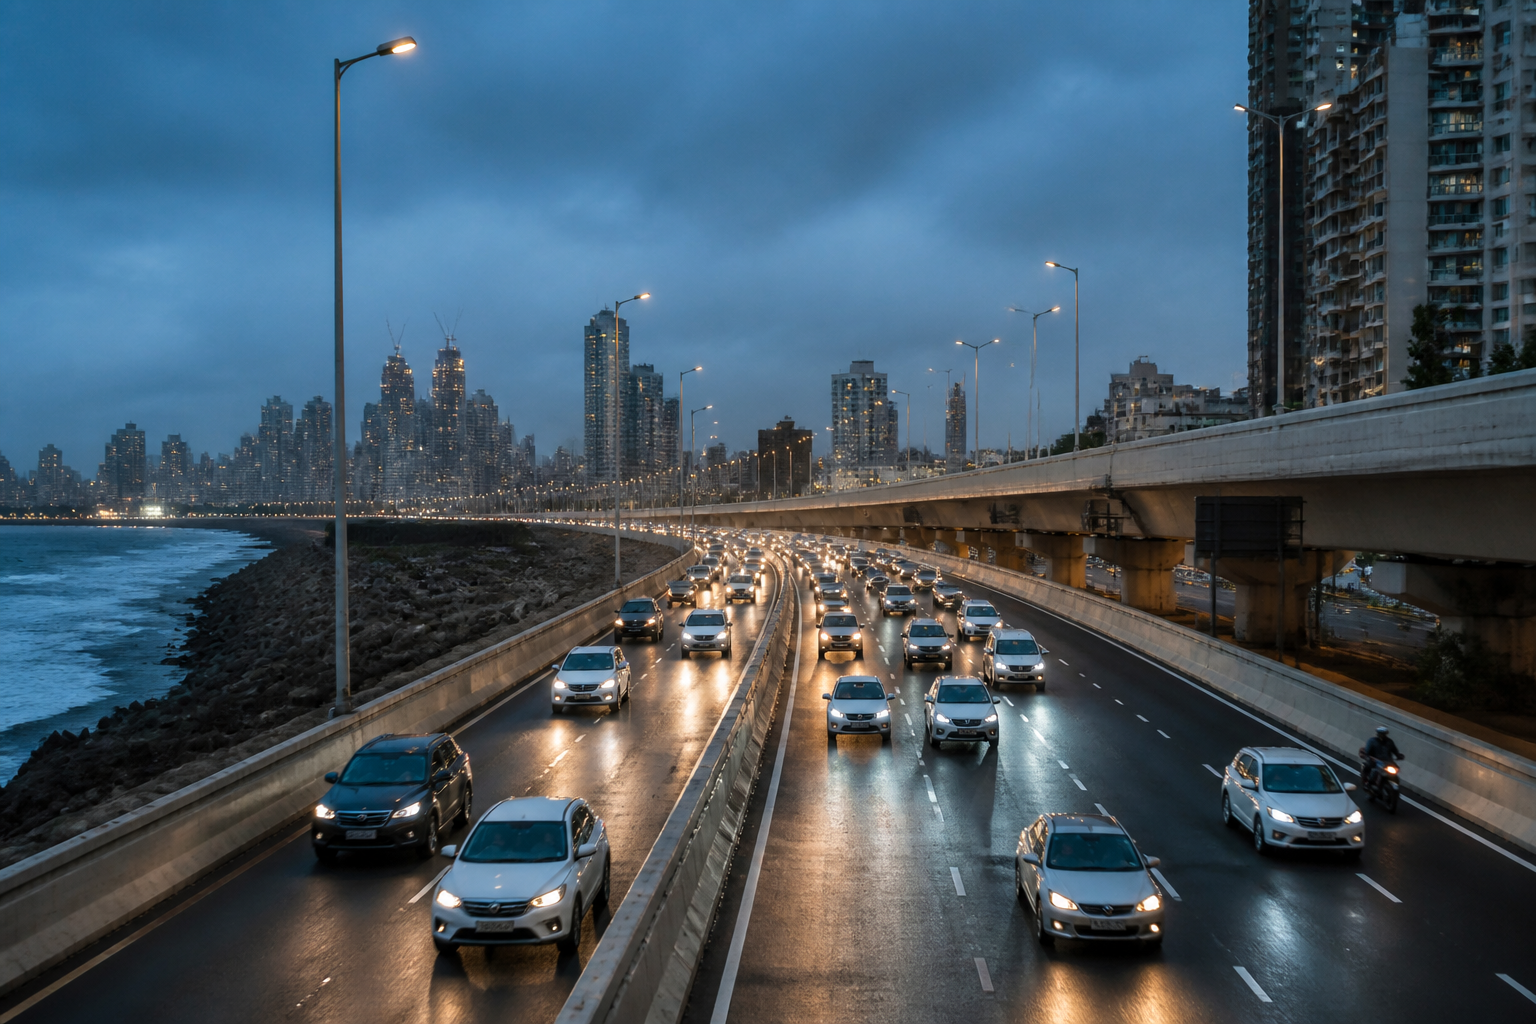
The Mumbai Coastal Road’s first year of 24-hour operations has produced a clear but incomplete success: more vehicles are using the route, yet traffic remains below the one-way volume originally expected for the corridor. The numbers show how extending access can change travel behaviour without necessarily resolving the larger question of how Mumbai should allocate limited road capacity.
According to a report by Loksatta, the coastal road was opened to traffic around the clock from 15 August 2025, after initially operating for only 16 hours a day. During its first year of 24-hour service, the route’s average daily traffic increased from about 34,538 vehicles to 62,640 vehicles. The report describes this as an increase of approximately 81 per cent.
The rise is significant because the change was not the construction of an entirely new corridor. It was, primarily, a change in operating availability. Before round-the-clock access, motorists could use the road from 7 am until midnight. The additional operating hours allowed the road to serve journeys that could not previously be made on the route during the overnight period.
The traffic distribution also changed. Before 24-hour operations, the road carried an average of 19,209 vehicles southbound and 15,330 vehicles northbound each day, for a combined total of 34,538 vehicles. After the operating hours were extended, southbound traffic reached 33,077 vehicles and northbound traffic reached 29,563 vehicles, taking the combined daily total to 62,640.
The figures indicate that demand exists in both directions rather than being concentrated on a single peak movement. Southbound traffic is higher than northbound traffic in the reported figures, but the difference is relatively limited compared with the overall increase. That pattern matters for a corridor designed to support movement across Mumbai’s southern road network: its usefulness is not restricted to a one-way commuter flow.
## What the traffic numbers reveal
The Loksatta report also presents a second measure of usage. Before 24-hour access began, the road recorded an average of approximately 1.135 million vehicle movements per month, including about 576,000 southbound and 558,000 northbound movements. After the change, monthly traffic rose to nearly 1.88 million vehicle movements, an increase of about 66 per cent according to the report.
The difference between the reported daily and monthly growth rates is important. Daily traffic increased from 34,538 to 62,640 vehicles, while the monthly figure increased from 1.135 million to nearly 1.88 million. These are not necessarily contradictory measures: daily averages and monthly totals can reflect different counting periods and reporting methods. But they should not be treated as interchangeable indicators.
The more consistent conclusion is that 24-hour access substantially increased use of the corridor. The road’s operating schedule had been a constraint on its availability, and removing that constraint unlocked additional demand. The figures therefore show not only that motorists value the route, but also that travel demand was being suppressed when access ended at midnight.
The report says the additional use has helped Mumbai residents save time and fuel. It does not provide a quantified estimate of the total time or fuel saved, nor does it establish whether the increase represents trips shifted from other roads, trips made at previously unavailable hours, or a combination of both. That distinction is central to assessing the road’s wider traffic impact.
If existing trips shifted to the coastal road, congestion may have been redistributed across the network. If a substantial share of the additional journeys became possible because the road remained open overnight, the corridor may also have expanded the total amount of motorised travel. The available figures establish the growth in use, but they do not by themselves establish the balance between these two effects.
## A corridor operating below its expected volume
The report states that approximately 68,000 vehicles in one direction had been expected on the road. The current traffic count, however, remains below that level, with 62,640 vehicles recorded in both directions combined each day. This comparison places the first-year growth in perspective. The road is being used much more heavily than before, but it has not yet reached the one-way volume cited as an expectation.
That gap raises an operational question rather than proving that the corridor has underperformed. Expected traffic may refer to a particular directional capacity or planning assumption, while the reported count is a combined total for both directions. The supplied report does not provide the underlying traffic model, the precise definition of the 68,000-vehicle expectation or the period over which that benchmark was calculated.
Even with that limitation, the figures show that the road’s performance cannot be judged only by whether traffic has increased. A road can attract more vehicles and still leave unanswered questions about capacity utilisation, network effects and the types of journeys it is serving. The first year of 24-hour operation has therefore generated a larger evidence base, but not a complete performance assessment.
The route’s usage also illustrates the institutional importance of operating policy. Infrastructure capacity is often discussed in terms of lanes, tunnels, bridges and interchanges. Yet the coastal road’s experience shows that hours of access can materially alter the effective capacity available to users. A road that is physically present but closed for part of the day is not equivalent to a road available throughout the day and night.
For municipal administrators, this means that traffic counts should be read alongside operating rules, maintenance schedules, safety arrangements and access restrictions. The reported change followed the decision to open the road 24 hours a day, making the operating regime a direct part of the corridor’s transport performance.
## The public transport question remains open
The report notes that demands for improvements and public transport services continue. That detail places the coastal road within a broader mobility debate. The corridor has recorded higher private-vehicle use after its hours were extended, while the supplied material does not provide comparable figures for buses, rail or other public transport services using or benefiting from the route.
This distinction matters because road use and public transport access address different parts of the mobility problem. A road can reduce travel time for motorists while leaving residents who do not own cars dependent on other modes. The available report records benefits in time and fuel for users of the coastal road, but it does not establish how those benefits are distributed across Mumbai’s population.
The traffic increase also does not, on its own, demonstrate that the road has reduced congestion across the city. No network-wide congestion figures, travel-time comparisons or traffic diversion data are included in the supplied report. The evidence supports a narrower conclusion: the coastal road has become substantially more used since it began operating around the clock.
That narrower conclusion is still important for planning. It suggests that access restrictions were influencing route choice and that a sizeable pool of potential users existed outside the original 16-hour operating window. It also shows why the public value of a major road cannot be assessed solely at the time of construction. Its operating rules, usage pattern and interaction with other modes become visible only after sustained use.
## What Mumbai should monitor next
The next stage of assessment will require consistent measurement of the corridor’s daily and monthly traffic, directional balance and relationship with surrounding roads. The difference between the reported 81 per cent daily increase and 66 per cent monthly increase underlines the need for clearly defined indicators and comparable counting periods.
The city would also need evidence on travel times, fuel consumption, accident patterns, maintenance closures, public transport use and traffic movement on parallel routes to determine the road’s full urban effect. Those metrics are not provided in the Loksatta report, so the first-year figures should be treated as a measure of corridor utilisation rather than a complete evaluation of the project.
The central lesson from the first year is that the Mumbai Coastal Road is not simply a fixed piece of infrastructure. Its performance changed materially when the city changed the hours during which people could use it. Traffic has risen from about 34,538 vehicles a day to 62,640, and monthly movements have increased from roughly 1.135 million to nearly 1.88 million, according to the reported figures. What remains unresolved is whether that growth primarily represents traffic shifted from elsewhere, newly enabled journeys or a combination of both. That question will determine what the corridor’s first year ultimately means for Mumbai’s wider transport system.
