


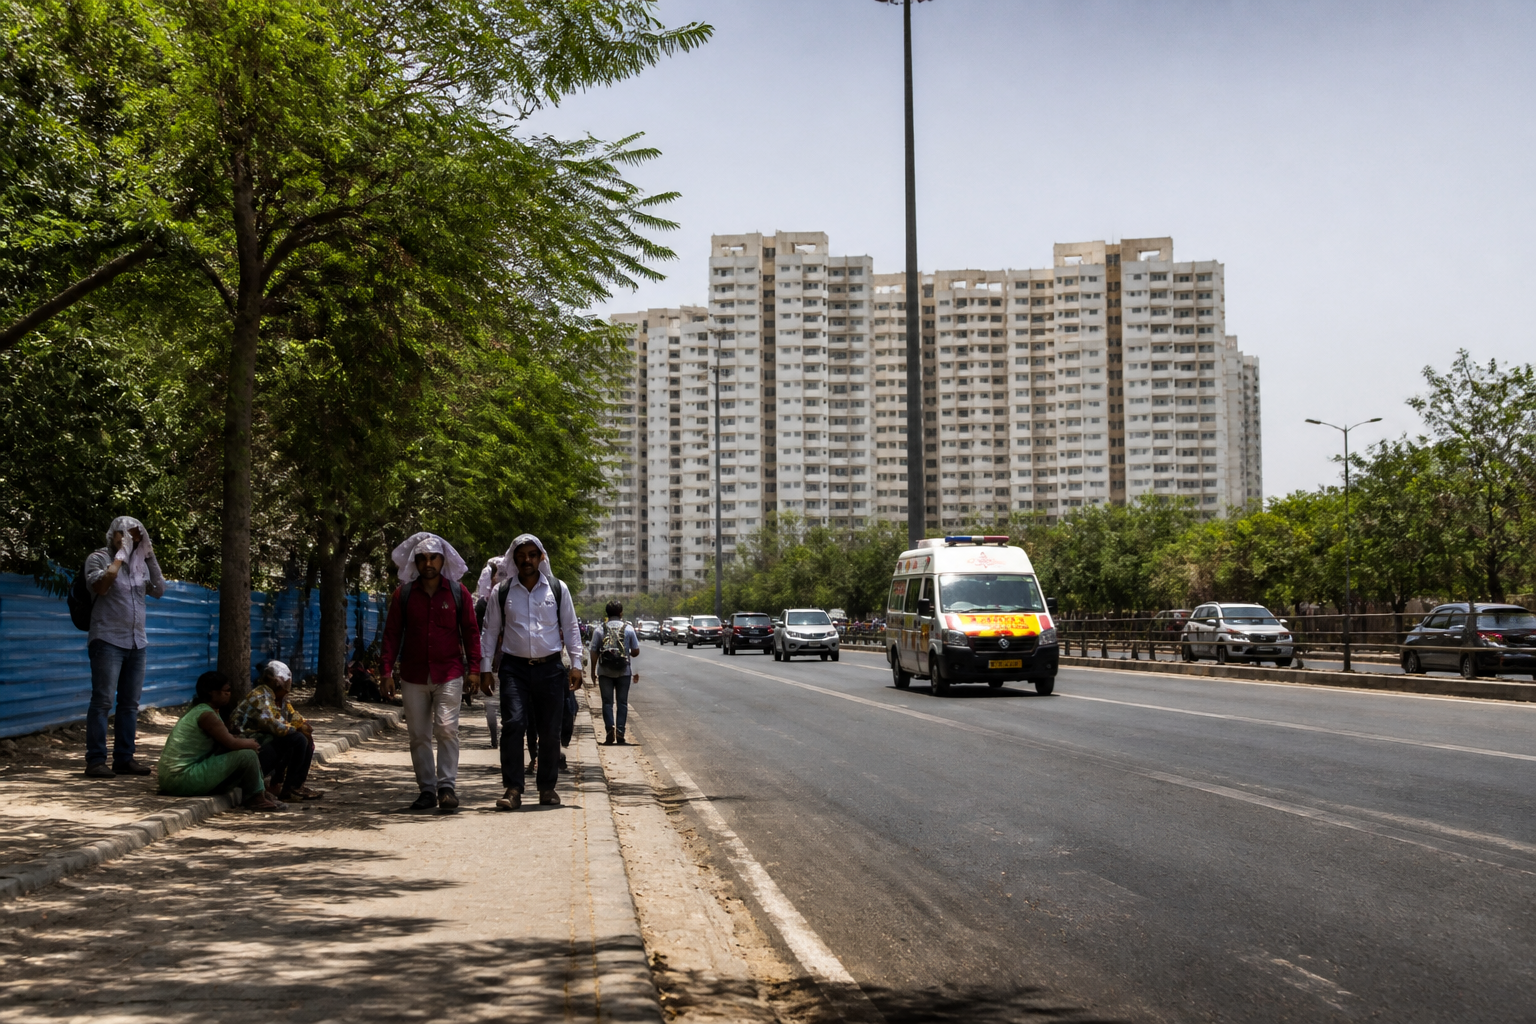
A Climate Central assessment reported that 11.7 crore Indians experienced at least 30 days of heat during June-August 2026 whose likelihood had increased because of climate change. Delhi-NCR was part of that wider pattern, but the local figures also show why heat cannot be treated as a uniform citywide problem: the number of high-risk days differed between cities and even between areas of Delhi.
The findings, reported by Jagran and attributed to Climate Central data, place Delhi’s recent summer conditions within two overlapping measurements. In Delhi, temperatures showed a strong climate-change influence on 20 days during the June-August period. Eighteen days were classified as risky heat days when compared with the local historical range. Two of those days were identified as additional days whose likelihood was increased by climate change.
These are different measures of the same climate signal. A strong climate-change influence indicates that the observed heat was more likely in the changed climate assessed by the Climate Shift Index. A risky heat day, meanwhile, was defined in the study as a day when the local daily average temperature exceeded the 90th percentile of the 1991-2020 temperature range. The distinction matters because a city can experience temperatures that are unusually dangerous for local conditions without every such day being counted as an additional climate-change-attributed day.
The national picture was broader. India’s seasonal average temperature between June and August was 0.7 degrees Celsius above the 1991-2020 average. Across the country, 39 days showed a strong climate-change influence on temperature, while 20 days were classified as risky heat days. Nine days were identified as additional days whose likelihood had increased because of climate change.
The assessment therefore does not describe only a short-lived temperature spike. It examines the frequency and intensity of heat against a historical baseline. The reported estimate that 11.7 crore people experienced at least 30 days of such heat provides a population-scale measure of exposure, while the city-level results show that exposure is not distributed evenly across the urban region.
In Delhi-NCR, Ghaziabad recorded 22 days with a strong climate-change influence and 19 risky heat days. Meerut also recorded 22 days with a strong influence and 18 risky heat days. Faridabad recorded 20 days in the first category and 16 risky heat days. New Delhi recorded the same counts as Faridabad. The figures supplied in the report do not cover every NCR city, so the comparison is limited to the places for which data were available.
The variation is also visible within Delhi. Najafgarh recorded 19 days with a strong climate-change influence and 17 risky heat days. One of those days was identified as an additional day made more likely by climate change. This difference between the wider Delhi figure and the Najafgarh figure points to the limits of treating the capital as a single thermal environment. The supplied data do not explain the causes of the local variation, but they establish that the heat signal was not identical across locations.
That is important for urban administration because citywide averages can conceal neighbourhood-level exposure. A municipal response designed around one number for the entire capital may not capture how heat conditions differ across districts or how the burden is distributed within the wider metropolitan region. The report does not provide ward-level health, income, housing or occupational data, so it cannot establish which groups faced the greatest harm. It does, however, show that location-specific measurement is necessary before making such assessments.
The study’s methodology also gives the findings an institutional dimension. The local 1991-2020 temperature range acts as the reference period for identifying risky heat days, while the Climate Shift Index is used to assess the influence of climate change. The reference period is not merely a technical detail: it determines what counts as unusually hot for a location. Using a local baseline allows the assessment to distinguish between general seasonal warmth and heat that is unusually severe for that area.
The report links prolonged heat with consequences beyond temperature records. It refers to record forest fires, drought and increasing pressure on emergency and health services in affected areas. These observations broaden the urban question from heat measurement to service capacity. When heat persists, pressure can move through several systems at once, including health facilities, emergency response and water-dependent livelihoods. The supplied material does not quantify the additional burden on Delhi’s services, so the city-specific operational impact remains to be established.
For Delhi-NCR, the institutional challenge is complicated by the region’s administrative structure. The reported figures span Delhi, New Delhi, Najafgarh, Ghaziabad, Meerut and Faridabad, which are governed through different administrative arrangements. A heat event does not stop at a municipal or state boundary, but the response systems that monitor temperature, issue warnings and manage health or emergency services may operate across separate jurisdictions. The report does not detail how these agencies coordinated during the period studied, making that an important area for further examination rather than a conclusion that can be drawn from the available evidence.
The data also show why heat planning cannot rely only on the national average. India’s average seasonal temperature was 0.7 degrees Celsius above the 1991-2020 average, but Delhi’s June-August average increased by 0.1 degrees Celsius against its local baseline. At the same time, Delhi recorded 18 risky heat days and 20 days with a strong climate-change influence. The combination suggests that seasonal average change and the number of high-risk individual days measure different aspects of heat exposure. A modest change in the seasonal average does not mean that residents experienced only modest risk on each day.
This distinction is especially relevant to urban infrastructure. Average temperature figures can support long-term climate assessment, while daily heat thresholds are more directly connected to warnings, work conditions, school operations, public health preparedness and emergency planning. The source report does not provide policy thresholds or operational schedules for these services, but its data indicate that the timing and duration of heat deserve attention alongside seasonal averages.
The population estimate of 11.7 crore also places the issue beyond the boundaries of Delhi. Heat risk is being experienced across a large national population, while the Delhi-NCR figures demonstrate how metropolitan regions can contain several overlapping exposure patterns. This makes climate resilience both a national concern and a local governance task. National assessments can identify the scale of the trend, but local authorities need location-specific information to understand where the risk is concentrated.
What the evidence confirms is that climate-linked heat affected a substantial population during June-August 2026, that India recorded a seasonal average 0.7 degrees Celsius above its 1991-2020 average, and that Delhi-NCR cities experienced different numbers of risky and climate-influenced heat days. What remains unestablished in the supplied material is how those differences translated into mortality, illness, electricity demand, water stress, labour losses or neighbourhood-level vulnerability.
The next layer of scrutiny should therefore focus on how these temperature findings connect with public-health records, emergency-service demand and city-level preparedness. Until those links are documented, the Climate Central assessment is best read as an exposure map and a warning about uneven urban heat risk—not as a complete account of the human or administrative cost.
