


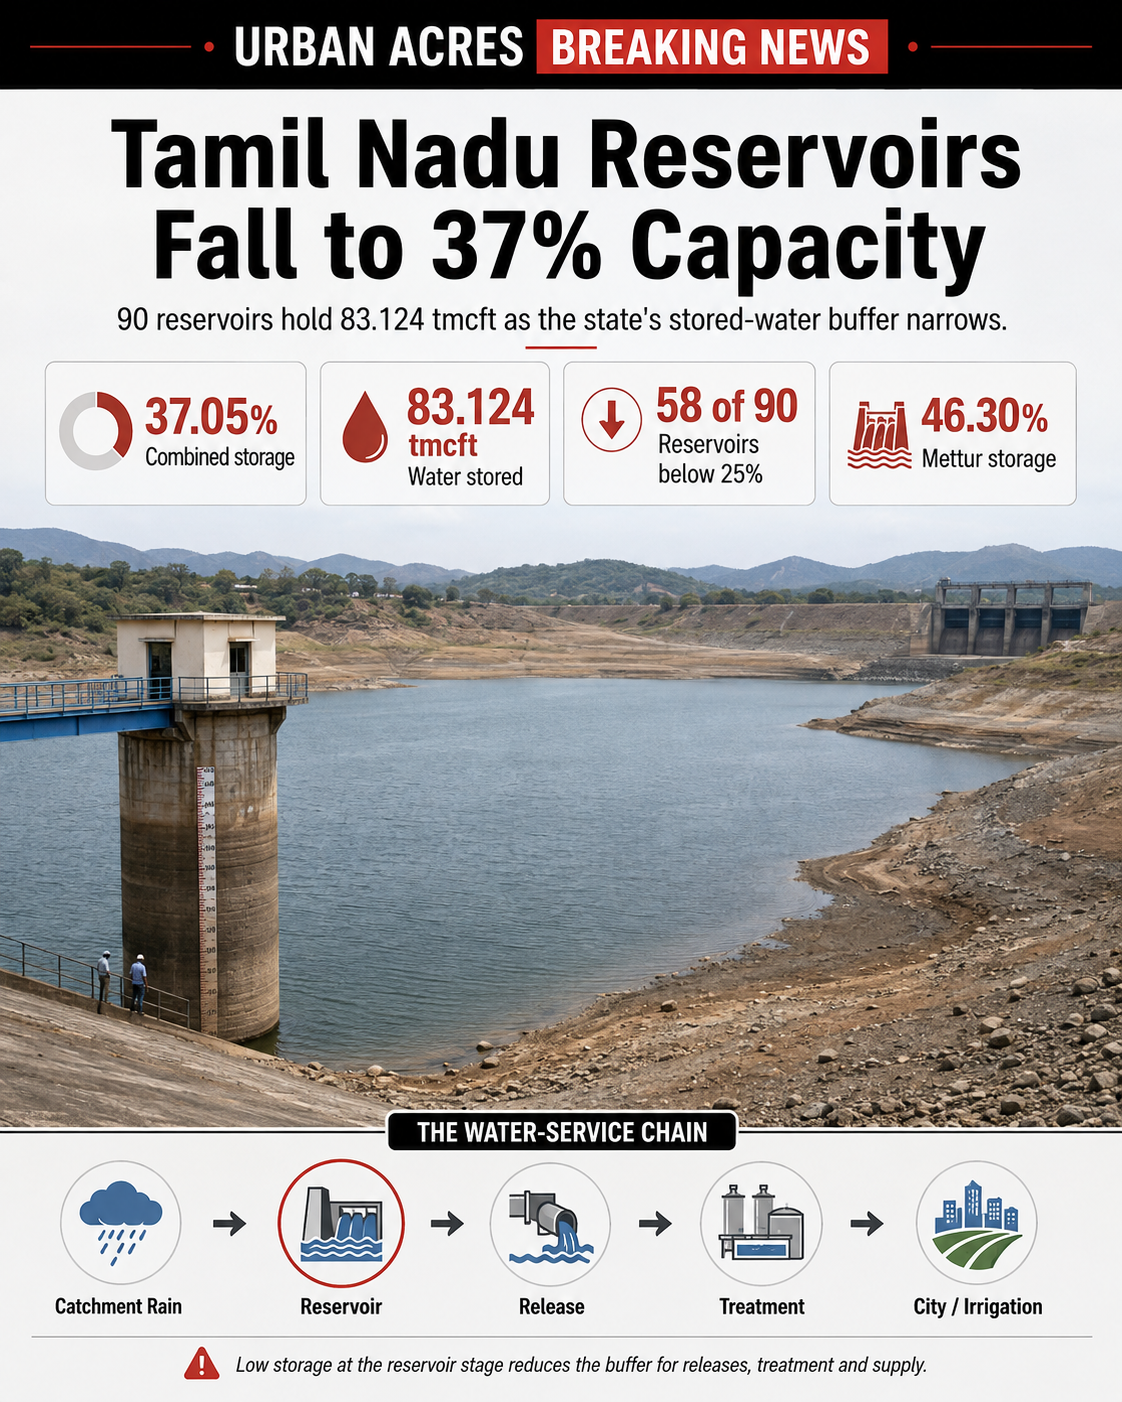
Tamil Nadu’s 90 monitored reservoirs held 83.124 tmcft of water on 16 August, just 37.05% of their combined capacity. The immediate concern is not simply how empty the reservoirs are, but how much operating buffer remains for drinking-water and irrigation demand before the northeast monsoon begins replenishing key systems.
Tamil Nadu entered the second half of August with reservoir storage substantially below last year’s level, tightening the margin available to water managers as the state waits for stronger replenishment.
Combined storage across 90 reservoirs stood at 83.124 thousand million cubic feet against a total capacity of 224.343 tmcft on Sunday, 16 August, according to Water Resources Department data reported by The New Indian Express. That works out to 37.05% of capacity.
The distribution is as important as the statewide average. Fifty-eight reservoirs were reportedly below one-quarter capacity, meaning low storage is spread across much of the monitored network rather than being confined to a small number of structures.
The year-on-year deterioration is sharper than the source suggests
The report gives corresponding storage last year as 189.545 tmcft.
That means current storage is about 56% lower than last year’s level, based on the two figures, rather than merely 47% lower or last year’s storage being 47% higher.
That distinction matters because it shows how significantly the state’s stored-water buffer has contracted.
Mettur illustrates the change. The Cauvery reservoir held 43.275 tmcft, or 46.30% of capacity, compared with 91.114 tmcft, or 97.48%, at the same point last year.
But rainfall and reservoir storage are not the same metric
It would be tempting to describe the storage deficit simply as a failed southwest monsoon.
The hydrological picture is more complicated.
IMD data for 1 June to 16 August show Tamil Nadu receiving 143.8 mm of rainfall against a normal 159.6 mm, a departure of -10%. IMD categorises rainfall within -19% to +19% as normal.
Yet “normal” statewide rainfall does not guarantee normal reservoir inflows.
Reservoir recharge depends on rainfall over individual catchments, intensity and timing, upstream releases, soil saturation and river flows. Rain falling outside important catchments may contribute little to storage in a reservoir serving a particular irrigation or drinking-water system.
That is why Urban Acres considers catchment inflow and usable storage, rather than statewide rainfall alone, the more meaningful measure of water-security pressure.
Tamil Nadu had already entered summer with a shrinking buffer
The August figure should also be read as part of a longer depletion cycle.
In March, storage across the same system was reported at 100.382 tmcft, or 44.74% of capacity, down from 168.418 tmcft at the beginning of January.
By mid-August it had fallen further to 83.124 tmcft.
The underlying story is therefore not simply “reservoirs suddenly fall to 37%.” It is that drawdown has continued while replenishment has not restored the storage cushion available at the same stage last year.
Drinking-water security cannot be measured by one statewide percentage
The WRD official cited in the report said drinking-water demand was still being managed but that balancing supply and demand was becoming increasingly difficult in reservoir-dependent areas.
That qualification is crucial.
A reservoir percentage does not translate directly into household supply.
Urban water security operates through a chain:
Reservoir/source → treatment → bulk transmission → balancing storage → municipal distribution → pressure → household connection → supply hours
Cities and towns may also use multiple sources, including groundwater, desalination, inter-basin transfers or local reservoirs.
The relevant public-service question is therefore not merely:
How full are Tamil Nadu’s reservoirs?
It is:
How much dependable drinking-water supply can each system maintain at present demand levels under different inflow scenarios?
That information is not contained in the headline storage figure.
Tail-end systems are the bigger warning signal
The report says water availability remained relatively normal along parts of the Cauvery stretch between Mettur and Tiruchy, while downstream and tail-end districts were experiencing greater stress.
That raises an equity issue frequently obscured by state-level averages.
A 37% statewide storage figure does not mean every resident faces the same risk.
Water security depends on geography: source proximity, reservoir dependency, pumping infrastructure, interconnections, groundwater availability and priority rules all influence who experiences scarcity first.
Urban Acres therefore considers district- and system-level reserve data more useful than a single aggregate percentage for evaluating service risk.
The Cauvery dimension requires legal and operational precision
The triggering report also links Mettur storage to flows from Karnataka’s Cauvery reservoirs, stating that KRS, Kabini, Harangi and Hemavathy were comparatively better stocked while Tamil Nadu had received less water than required for June and July.
The Cauvery allocation system operates within the legal framework ultimately modified by the Supreme Court’s 2018 judgment, which is listed by the Central Water Commission among the governing interstate-water-dispute orders.
But current-year compliance is not something Urban Acres should determine merely by comparing two numbers quoted anonymously.
It requires verified measurements at the designated interstate point, monthly accounting, permitted adjustments and any Cauvery Water Management Authority directions.
Until those records are independently reviewed, the reported June and July shortfalls should remain attributed claims rather than an Urban Acres legal finding of non-compliance.
The northeast monsoon is increasingly important—but it is not yet an outcome
The source expects Tamil Nadu to depend more heavily on the northeast monsoon later this year to replenish reservoirs.
That is reasonable as an operational expectation, but future rainfall cannot be treated as stored water.
The planning challenge is what happens between today’s storage level and actual recharge.
Reservoir operators need to continuously balance:
drinking-water reserve → irrigation releases → environmental/river requirements → evaporation losses → expected inflow → emergency buffer
The public cannot evaluate those trade-offs from reservoir percentages alone.
What Tamil Nadu should disclose next
The WRD should publish a reservoir-level water-security dashboard that goes beyond water levels.
For each major reservoir it should show:
- current live storage;
- dead storage, where applicable;
- daily inflow;
- daily release;
- principal drinking-water commitments;
- irrigation commitments;
- forecast demand;
- previous-year comparison;
- 10-year or long-term average;
- projected storage under low-, normal- and high-inflow scenarios;
- operating thresholds;
- and the next decision point for modifying releases.
Municipal water agencies should separately disclose how many days of dependable supply their systems can maintain under existing conditions.
That would convert a headline statistic into a measurable service-risk framework.
For citizens, 37% is a warning signal. It is not yet a complete description of water security.
