


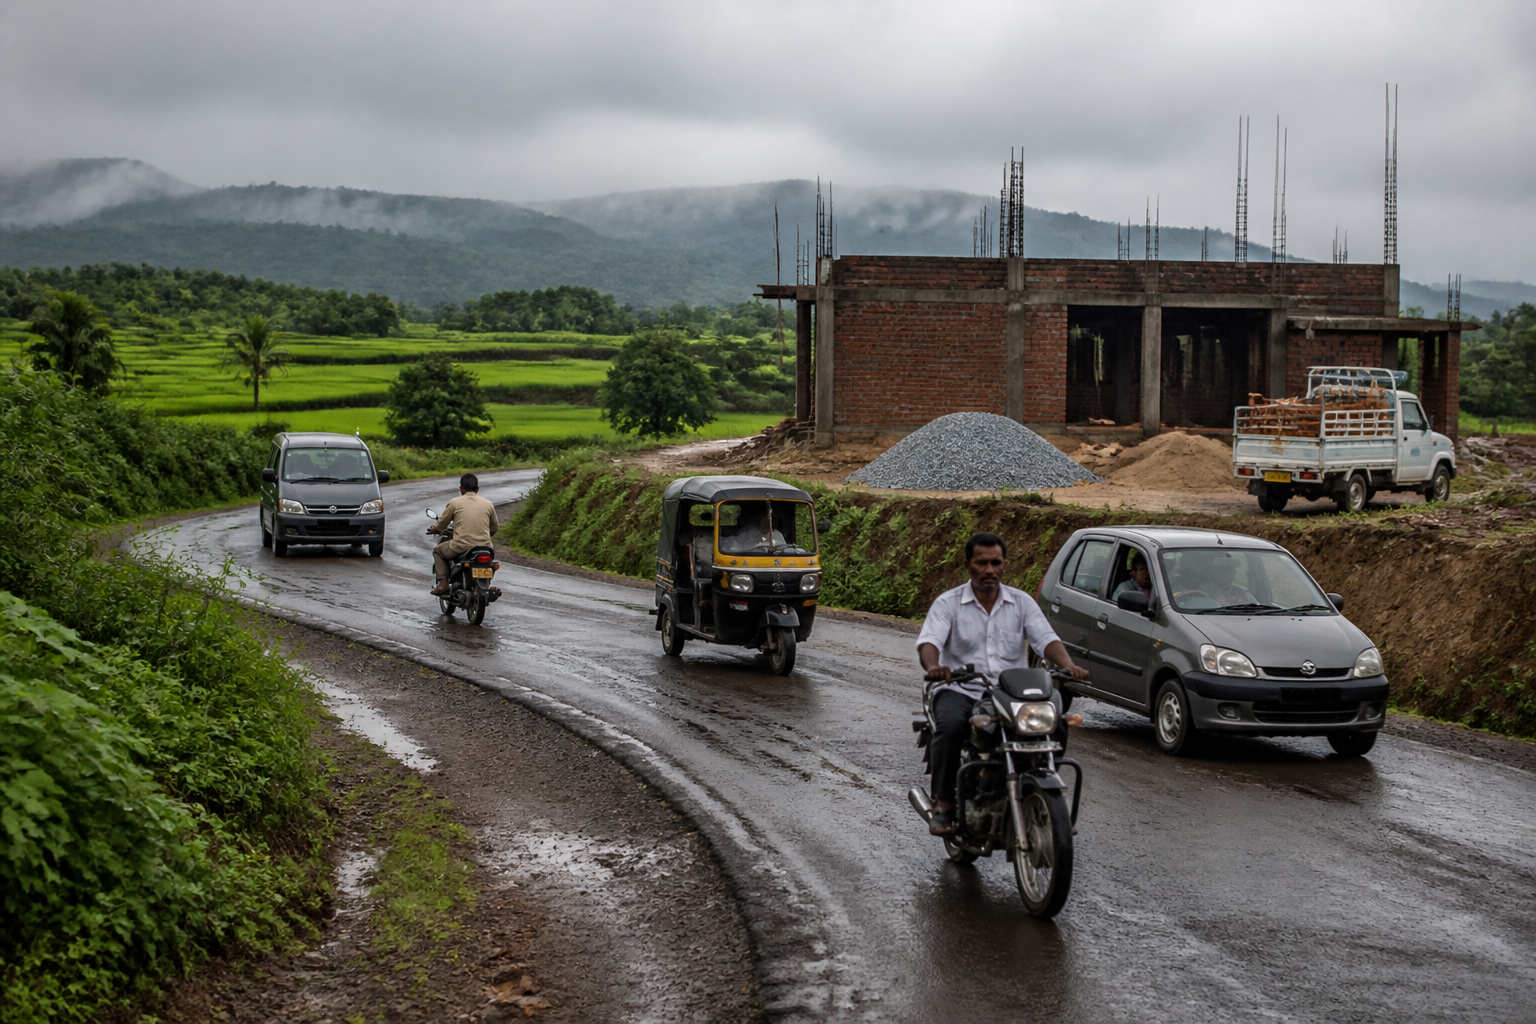
Passenger vehicles, two-wheelers, three-wheelers and commercial vehicles pushed rural vehicle sales sharply higher in August, even as tractor demand weakened. The contrast offers a more nuanced reading of rural economic activity: agricultural conditions were under pressure, but mobility, goods movement and construction-related demand continued to expand.
Rural vehicle retail grew 19.79 per cent year-on-year in August, ahead of 15.17 per cent growth in urban markets, according to the data cited by The Hindu BusinessLine. The increase was broad-based across several categories. Rural passenger-vehicle registrations rose 24.99 per cent, two-wheelers increased 20.25 per cent and commercial vehicles grew 16.33 per cent. Three-wheelers rose 23.95 per cent in rural markets, even as urban registrations declined 6.95 per cent.
Tractors moved in the opposite direction. Rural tractor registrations grew only 3.09 per cent year-on-year and fell 24.43 per cent from July. At the national level, tractor retail increased 0.84 per cent to 87,977 units but declined 25.03 per cent month-on-month. The divergence was also visible in wheeled construction equipment, where rural registrations rose 39.04 per cent.
These figures do not describe a single rural market responding uniformly to the same economic conditions. They separate demand linked closely to farm activity from demand connected to household mobility, local commerce, transport services and construction. That distinction is important because tractor purchases are more directly tied to sowing, crop conditions and expectations about farm income, while other vehicle categories can reflect a wider range of livelihoods.
### Rural vehicle sales and the farm-non-farm divide
The strongest analytical signal in the August figures is the gap between tractors and the rest of the rural vehicle market. Tractors are productive assets whose purchase timing is closely associated with agricultural operations. Motorcycles, passenger vehicles, three-wheelers and commercial vehicles, by contrast, serve multiple purposes. They can support commuting, passenger transport, small-business activity, deliveries and movement between villages and nearby towns.
The available evidence does not establish that every increase in non-tractor registrations came from a particular occupation or income group. It does, however, show that rural demand was not moving in lockstep with the agricultural cycle. The rise in three-wheelers and commercial vehicles points to continuing demand for transport and goods movement, while the increase in construction equipment indicates activity beyond crop production.
FADA President Sai Giridhar described this as a decoupling of rural demand from the monsoon. His assessment was that the farm-income-linked segment had softened while livelihood mobility, goods movement and construction continued to accelerate. The statement provides an interpretation of the registration data, rather than proof that the rural economy has become independent of agriculture. The figures show divergence, not the disappearance of agricultural influence.
Passenger vehicles were the largest rural growth category identified in the report. Their 24.99 per cent increase was more than twice the 10.93 per cent growth recorded in urban markets. The comparison suggests that rural passenger-vehicle demand was particularly strong during the period, although the supplied material does not identify whether the increase was driven by replacement purchases, first-time buyers, financing conditions or a particular set of states.
Two-wheelers also recorded strong rural growth of 20.25 per cent. In many rural settlements, two-wheelers function as basic mobility infrastructure, connecting households to markets, schools, workplaces, health services and administrative centres. The registration increase therefore captures more than consumer preference. It also reflects the continuing importance of individual mobility where public transport options may not meet all travel needs. The supplied report does not provide enough evidence to quantify that relationship, but the category’s performance reinforces the broader pattern of rural mobility demand.
### What the monsoon data shows
The divergence emerged despite weak rainfall conditions. Cumulative rainfall was reported to be about 14 per cent below the long-period average as of August 30, with 14 states recording rainfall deficits. Reservoir storage was around 64 per cent of capacity, compared with nearly 78 per cent at the corresponding point a year earlier.
Those indicators help explain why tractors were treated as the clearest sign of monsoon-linked rural stress. Lower rainfall and weaker reservoir storage can affect the timing and confidence of agricultural activity, although the supplied material does not claim a direct one-to-one relationship between those measures and individual vehicle purchases. The figures establish a difficult agricultural backdrop alongside stronger performance in other vehicle categories.
The timing of the agricultural cycle was another factor. Hemal Thakkar, Senior Practice Leader and Senior Director at CRISIL Intelligence, attributed the sequential decline in tractor sales largely to the completion of Kharif sowing. Sowing had supported stronger demand in the preceding months, and the period after sowing was described as quieter for farm activity. Tractor purchases therefore moderated as the immediate operational requirement eased.
Thakkar also said heavy rainfall during the final eight to 10 days of August created flood-like conditions in some regions, disrupting dealership footfalls and registrations. This introduces an operational factor into the sales data. A registration decline may reflect not only purchasing decisions but also the ability of buyers and dealers to complete transactions during adverse weather. The available material does not separate those effects.
CRISIL Intelligence estimated that tractor retail, after adjusting for Telangana, grew 3-5 per cent year-on-year in August. That estimate differs from FADA’s unadjusted national growth figure of 0.84 per cent. The measures are not directly identical because they use different bases, but both indicate that tractor growth substantially trailed the broader rural vehicle market.
### The significance of category differences
Vehicle registrations are not a complete measure of rural prosperity. They do not by themselves reveal household income, debt levels, ownership costs, utilisation rates or whether purchases were made by individuals, businesses or fleet operators. Nor does a strong registration month prove that the gains will persist. What the figures can show is where demand was visible and which parts of the rural economy were active at a particular point in time.
The category pattern makes the August data more informative than a single rural-growth number. A 19.79 per cent increase in total rural vehicle retail could have been interpreted as a broad improvement in rural purchasing power. The tractor figures complicate that interpretation. They suggest that farm-linked capital expenditure was more restrained even while other forms of mobility and commercial activity expanded.
The three-wheeler numbers are especially significant in this comparison. Rural registrations increased 23.95 per cent while urban registrations contracted 6.95 per cent. Three-wheelers often operate at the interface between settlements, markets and local transport networks, but the supplied material does not specify their exact use in the reported markets. The data nevertheless identifies a strong rural-urban contrast in a category associated with movement of people or goods.
The 39.04 per cent increase in rural wheeled construction-equipment registrations provides a second signal of non-farm activity. Construction equipment demand can be connected to building, roadwork or other forms of physical development, but the source does not identify the projects, locations or buyers involved. It would therefore be premature to use the figure as a measure of overall rural construction output. It is better understood as an indicator that some construction-related demand was active despite the agricultural weakness.
### A broader urban and regional connection
The data also challenges a strict rural-urban separation. Rural vehicle demand is connected to nearby towns, district markets, transport corridors and construction sites. Passenger vehicles and two-wheelers can support movement between dispersed settlements and urban centres. Commercial vehicles and three-wheelers link production, trade and consumption across the rural-urban boundary.
For cities, this matters because regional mobility systems do not end at municipal limits. The performance of rural transport categories can influence the movement of workers, goods and customers into smaller urban centres. However, the supplied report does not provide route-level, employment or freight-flow data, so the precise effect on towns and cities cannot be measured here.
The rural-urban comparison also shows why national vehicle numbers need to be read by category and geography. Urban vehicle retail grew 15.17 per cent overall, below rural growth of 19.79 per cent. Yet urban three-wheeler registrations fell while rural three-wheelers rose. The contrast indicates that national averages can conceal different mobility and economic conditions across settlement types.
The evidence confirms three points. First, rural vehicle demand was strong in August relative to urban demand. Second, the strength was concentrated across non-tractor categories rather than being evenly shared with farm machinery. Third, rainfall deficits, lower reservoir storage, the post-sowing cycle and weather-related disruptions formed a difficult agricultural context for tractor sales.
What remains uncertain is whether the non-farm-led demand will continue, how much of it reflects financing or replacement cycles, and how the trends vary across states and districts. The next useful indicators will be subsequent rural registration data, tractor demand after the post-sowing slowdown, rainfall and reservoir conditions, and whether commercial, three-wheeler and construction-equipment registrations maintain their momentum.
