


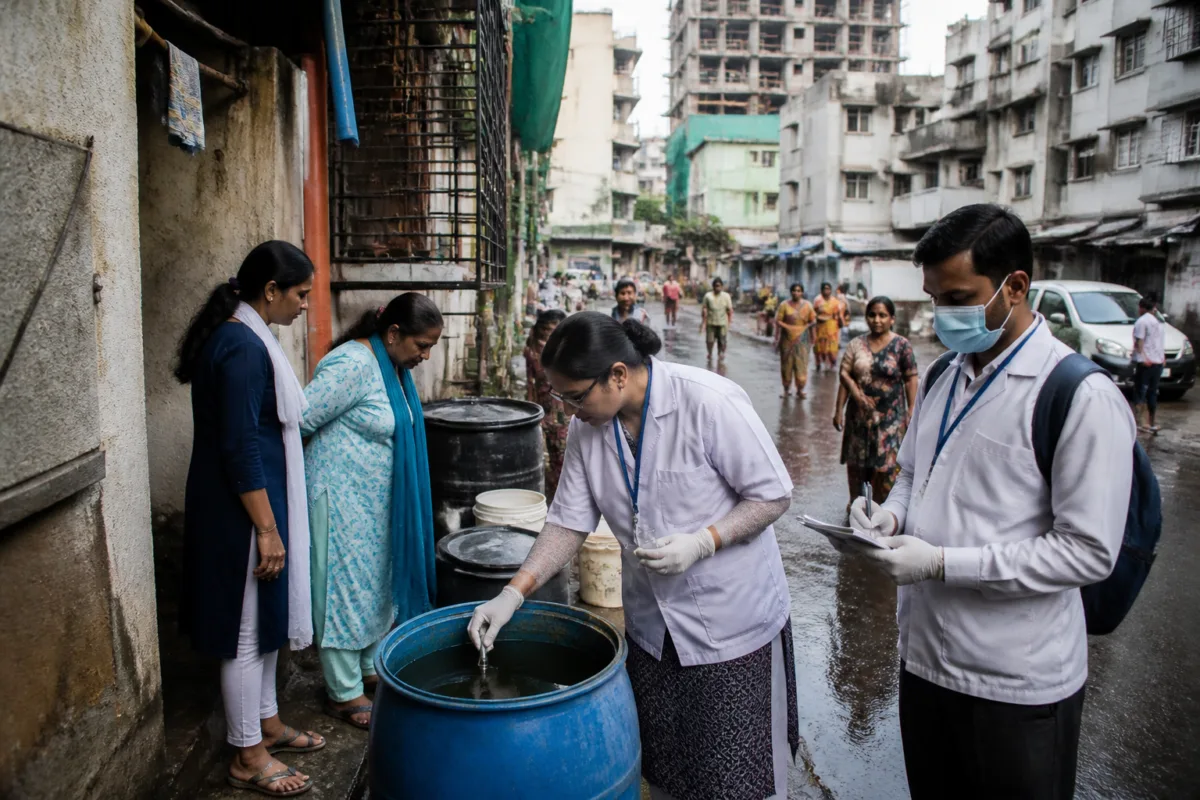
Pune’s dengue outbreak is no longer just a citywide seasonal rise. The Pune Municipal Corporation’s own ward-level figures show a sharply uneven pattern: four of the city’s 16 wards accounted for about half of the 843 laboratory-confirmed cases recorded in October, while six wards reported declines from the previous month. That split turns the latest numbers into a test of how precisely the city can identify and control local mosquito-breeding conditions.
The PMC data, reported by the Times of India, recorded 2,486 dengue cases between January 1 and October 30. October was the worst month so far, with 843 cases, up 27% from September’s 662 and 64% from August’s 512. The increase was not only a continuation of the monsoon-season rise but also the largest absolute monthly jump in the period, with 181 more cases than in September.
More than four in five reported cases occurred during August, September and October. These three months together accounted for 2,017 cases, or 81% of the January-to-October tally. The concentration indicates that the city’s dengue burden is being shaped by a short, high-intensity transmission window rather than by an evenly distributed rise across the year.
That pattern matters for municipal administration because the four wards with the highest October counts were not interchangeable parts of a single citywide outbreak. Aundh-Baner recorded 152 cases, followed by Yerawada-Wadgaonsheri with 110, Dhankawadi-Sahakarnagar with 92 and Keshavnagar with 74. Together, they contributed 428 cases, slightly more than half of the city’s October total.
Aundh-Baner was both October’s highest-count ward and the ward with the highest cumulative tally, at 364 cases. Its monthly count rose from 66 in August to 107 in September and 152 in October. Yerawada-Wadgaonsheri recorded one of the sharpest increases, moving from 42 cases in August to 60 in September and 110 in October. Its September-to-October increase was 83%.
Dhankawadi-Sahakarnagar followed a similar trajectory, rising from 36 cases in August to 54 in September and 92 in October. Keshavnagar, meanwhile, increased from 11 cases in August to 49 in September and 74 in October. The figures suggest that the most rapidly worsening wards were not necessarily the same as those with the largest cumulative burden, making both current surveillance and historical tracking important.
The concentration becomes clearer when the monthly changes are compared. The combined September-to-October increase in Aundh-Baner, Yerawada-Wadgaonsheri and Dhankawadi-Sahakarnagar was 133 cases. That represented nearly three-quarters of Pune’s net monthly rise of 181 cases. Their combined tally increased from 144 cases in August to 221 in September and 354 in October.
Other parts of the city recorded a different trend. Dengue cases in Kondhwa-Undri rose from 30 in August to 48 in September and 65 in October. Tilak Road-Sinhagad Road nearly doubled its count from 28 in September to 55 in October. But Kothrud reported 73 cases in October, down from 80 in September, while Nagar Road-Wagholi fell from 83 to 71, matching its August count. Overall, ten wards recorded increases and six recorded declines between September and October.
This unevenness challenges a purely citywide response. If six wards were already seeing fewer cases while four wards accounted for half of the October total, a single uniform enforcement or inspection strategy may not reflect where transmission conditions are changing most quickly. The available data does not establish why the wards diverged, but it does establish that the next layer of investigation has to operate below the citywide level.
PMC assistant health officer Rajesh Dighe, who is in charge of vector-borne infections, attributed the rise to conditions that can support mosquito breeding after the monsoon. These include stagnant water spots, construction sites, household water storage during supply interruptions, and warm, humid conditions. The explanation connects dengue surveillance to several everyday systems of the built environment: construction management, water reliability, property maintenance and post-monsoon drainage.
Those conditions also distribute responsibility across more than one type of institution or property owner. Stagnant water can occur in public spaces, private premises, construction sites or household storage containers. A municipal health team may identify and issue a notice, but the persistence of the breeding site can depend on the response of residents, establishments, contractors, site managers and other civic departments. The case numbers therefore measure more than disease incidence; they also reveal where routine urban maintenance and enforcement are failing to prevent risk from accumulating.
The PMC’s enforcement figures show the scale of that administrative effort. In October, civic teams surveyed 2.94 lakh homes and establishments and issued 448 notices. Across the year, they investigated 16 lakh establishments and issued more than 3,099 notices. Penalties totalled Rs6.47 lakh, including Rs90,400 collected in October.
These numbers demonstrate extensive inspection activity, but they do not by themselves show whether inspections eliminated breeding sites, reduced repeat violations or changed case trajectories in individual wards. The supplied report does not provide ward-wise inspection numbers, the number of breeding sites found, response times, repeat-offender data or a comparison between notices and subsequent dengue cases. Those gaps are important because enforcement volume and public-health impact are not identical measures.
The same limitation applies to the relationship between construction and dengue. Construction sites are identified by the PMC health official as one possible source of stagnant water, but the available data does not specify how many October cases were associated with construction locations or how many sites were inspected. It is therefore possible to identify construction-related water accumulation as an urban risk mentioned by the authority, but not to quantify its contribution to the ward totals.
Household water storage presents another institutional connection. The PMC’s explanation links storage during supply interruptions to mosquito-breeding risk, but the supplied material does not provide ward-wise information on water interruptions, storage practices or service reliability. That leaves an important urban question unresolved: whether the areas with rising dengue counts also experienced particular water-supply conditions during the period.
The figures do, however, establish a clear operational priority. October contributed nearly 34% of the January-to-October total, and the August-to-October period contributed 81%. A city response that treats dengue as a stable annual background problem would miss the concentration visible in the latest data. The reported ward pattern gives the PMC a basis for directing closer investigation towards Aundh-Baner, Yerawada-Wadgaonsheri, Dhankawadi-Sahakarnagar and Keshavnagar, while continuing surveillance in wards where cases are rising from lower bases.
Pune’s dengue numbers also show why ward-level public-health data is valuable to urban governance. Citywide totals communicate the scale of the problem, but they can conceal opposing local movements. A total of 843 cases in October does not reveal that some wards were declining, that three wards drove most of the net increase, or that Keshavnagar’s count rose from 11 in August to 74 in October. Those distinctions matter for inspection planning, enforcement and communication with residents.
What the evidence confirms is a concentrated and rapidly worsening dengue burden during October, following a steep rise through August and September. It also confirms that PMC surveillance and enforcement intensified during the same period. What remains unestablished in the supplied material is whether the inspections and penalties reduced breeding conditions, how the wards differed in water and construction exposure, and why some wards recorded declines while others surged.
The next meaningful measure of the city’s response will therefore not be only the next monthly total. It will be whether ward-level case trends, inspection findings and enforcement actions are connected closely enough to identify the specific urban conditions driving transmission. The PMC’s reported data provides the starting point; the unresolved task is converting that information into targeted action at the locations where the increase is concentrated.