


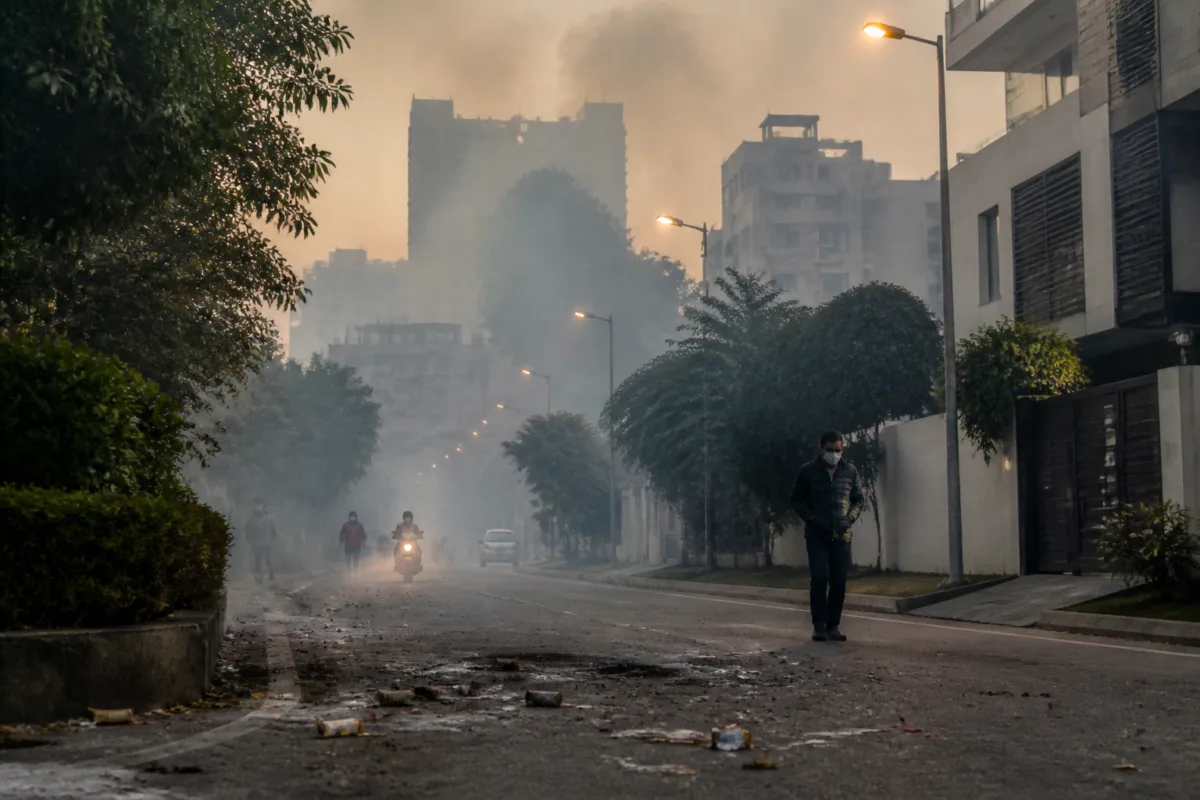
Nagpur air pollution reached its worst Diwali-period level in five years, with the city’s air quality index touching 272 after the festival and remaining in the poor category two days later. The readings point to a problem that extends beyond a single night of firecrackers: the city’s monitoring stations recorded severe particulate spikes across green, commercial and residential areas, while the available six-year comparison shows that post-festival pollution has generally worsened since 2021.
The immediate trigger was the concentration of firecracker use after 8pm on Sunday and into early Monday. According to the report, Nagpur’s AQI rose from an evening reading of 202 to 272, placing it in the poor category. The city was the fifth most polluted in Maharashtra during the period from 8pm on Diwali night through the following 24 hours. Pimpri-Chinchwad recorded an AQI of 303, followed by Nanded at 300, Pune at 297 and Malegaon at 285.
The numbers matter because they show both the intensity and spread of the episode. This was not a pollution event limited to a single crowded market or traffic corridor. PM2.5 reached the upper measurement limit of 500 micrograms per cubic metre at Ambazari, GPO Civil Lines and Ram Nagar. Mahal recorded PM2.5 at 474. PM10 also reached 484 at GPO Civil Lines and 416 at Mahal.
Ambazari’s presence among the worst-hit locations is significant in urban terms. The area is known for its green surroundings, yet the monitoring station recorded PM2.5 at the equipment’s upper limit. Residential Ram Nagar also experienced severe spikes. The readings indicate that festival-related particulate pollution travelled across different urban settings instead of remaining confined to commercial pockets where large crowds and traffic might otherwise be expected to dominate.
The persistence of poor air after the celebrations is the more important part of the episode. On November 10 evening, Nagpur’s overall AQI stood at 242, still within the poor category. GPO recorded the highest reading among the four monitored locations at 253, followed by Mahal at 247, Ram Nagar at 240 and Ambazari at 229. Even the lowest of these readings remained poor, suggesting that the city’s atmosphere did not quickly return to its pre-festival condition.
That persistence shifts the question from whether firecrackers created a short-lived spike to how the city absorbs and clears pollution once it is released. The supplied report attributes the immediate deterioration to fireworks and notes that atmospheric inversion was already worsening air quality. In an inversion, cooler air near the surface can restrict vertical dispersion, allowing pollutants to remain concentrated closer to where people live and breathe. The report does not establish the relative contribution of firecrackers, traffic, dust or other sources, but it does record the timing of the sharp rise and the continued poor readings afterwards.
Nagpur’s recent trend also makes the episode more than an isolated annual fluctuation. Post-festival AQI remained between 170 and 195 in 2021. The index crossed 200 in 2022 and remained in the poor category in 2023. The report says that 2024 and 2025 had relatively lower 24-hour averages, but both years still experienced significant localised particulate spikes. The 2026 peak of 272 was the highest in the five-year comparison cited in the report.
This pattern illustrates the limitation of relying only on citywide averages. A lower 24-hour average can coexist with dangerous exposure in particular neighbourhoods or during particular hours. The station-level readings from GPO Civil Lines, Mahal, Ram Nagar and Ambazari show why a single city figure does not fully describe how residents experience air pollution. A person living near a high-reading station may face a materially different exposure than the citywide AQI suggests.
The monitoring network therefore plays an important governance role. Continuous ambient air-quality stations provide the time-based and location-based data needed to identify when pollution rises, where it concentrates and whether it declines. In this episode, the movement from an evening AQI of 202 to 272 early the next morning, followed by readings above 229 at all four reported locations two days later, creates a clearer picture than a single festival-day average would provide.
The public-health implications are also broader than respiratory discomfort. Dr Prashant P Joshi, executive director of AIIMS Nagpur, told the Times of India that smog, sound and lights can affect blood sugar by triggering stress hormones and sleepless nights. He described these factors as hidden risks that can go undetected when individuals are blamed only for not following a healthy lifestyle. The report does not provide clinical measurements linking this particular pollution episode to changes in blood sugar among Nagpur residents, but the statement places the festival exposure within a wider health context.
The reported readings are especially relevant for vulnerable groups. Environmentalist Suresh Chopne said elderly people face higher risks from the chemicals released by firecrackers and argued that repeated cracker use during religious programmes, marriages and political celebrations has become a wider social practice. His comments are an assessment rather than an official measurement of the citywide trend, but they identify an urban management challenge: pollution is generated not only by one annual event but by repeated bursts associated with different forms of public and private celebration.
The institutional response remains divided across monitoring, public health and environmental regulation. The Maharashtra Pollution Control Board is represented in the report by regional officer Hema Deshpande, who said atmospheric inversion was already worsening air quality and that adding cracker smoke would make conditions worse. AIIMS Nagpur provides the medical perspective, while the continuous monitoring network supplies the readings. Together, these elements show that air pollution management requires coordination between environmental authorities, health institutions and local administration.
The evidence supplied does not specify whether Nagpur had a festival-specific emissions control plan, restrictions on firecracker timing, enforcement data, hospital admissions or a post-event clean-air response. It also does not establish how much of the measured particulate matter came directly from fireworks compared with other urban sources. Those gaps matter because effective policy depends on distinguishing the source, duration and location of pollution rather than treating every poor AQI episode as identical.
What the available evidence does establish is a recurring operational problem. The city recorded extreme particulate readings at multiple monitoring locations, including areas with different land-use patterns. Air quality remained poor after the celebration period. The longer comparison shows a deterioration from the 2021 post-festival range of 170 to 195 to readings above 200 in later years, culminating in 272 in 2026. These facts are sufficient to identify a worsening seasonal risk, even though they cannot by themselves explain every cause behind the trend.
For residents, the urban experience of this pollution is immediate: reduced visibility, smoke-filled neighbourhoods and exposure that continues after the sound of fireworks has stopped. For city institutions, the challenge is less visible but more structural. Monitoring must be continuous, data must be interpreted at neighbourhood level, health warnings must reach vulnerable residents, and festival-related enforcement must be connected to broader pollution-control systems. The report provides evidence of the first condition, but not enough information to assess the performance of the others.
Nagpur’s Diwali episode therefore raises a question about whether the city treats air pollution as a short-term festival spike or as a recurring urban risk requiring year-round governance. The AQI of 272, PM2.5 readings at or near the sensor ceiling and poor air two days later confirm the severity of this year’s event. The trend data indicate that the problem deserves continued monitoring, while the missing information on source apportionment, enforcement and health outcomes remains important for understanding what should happen next.