


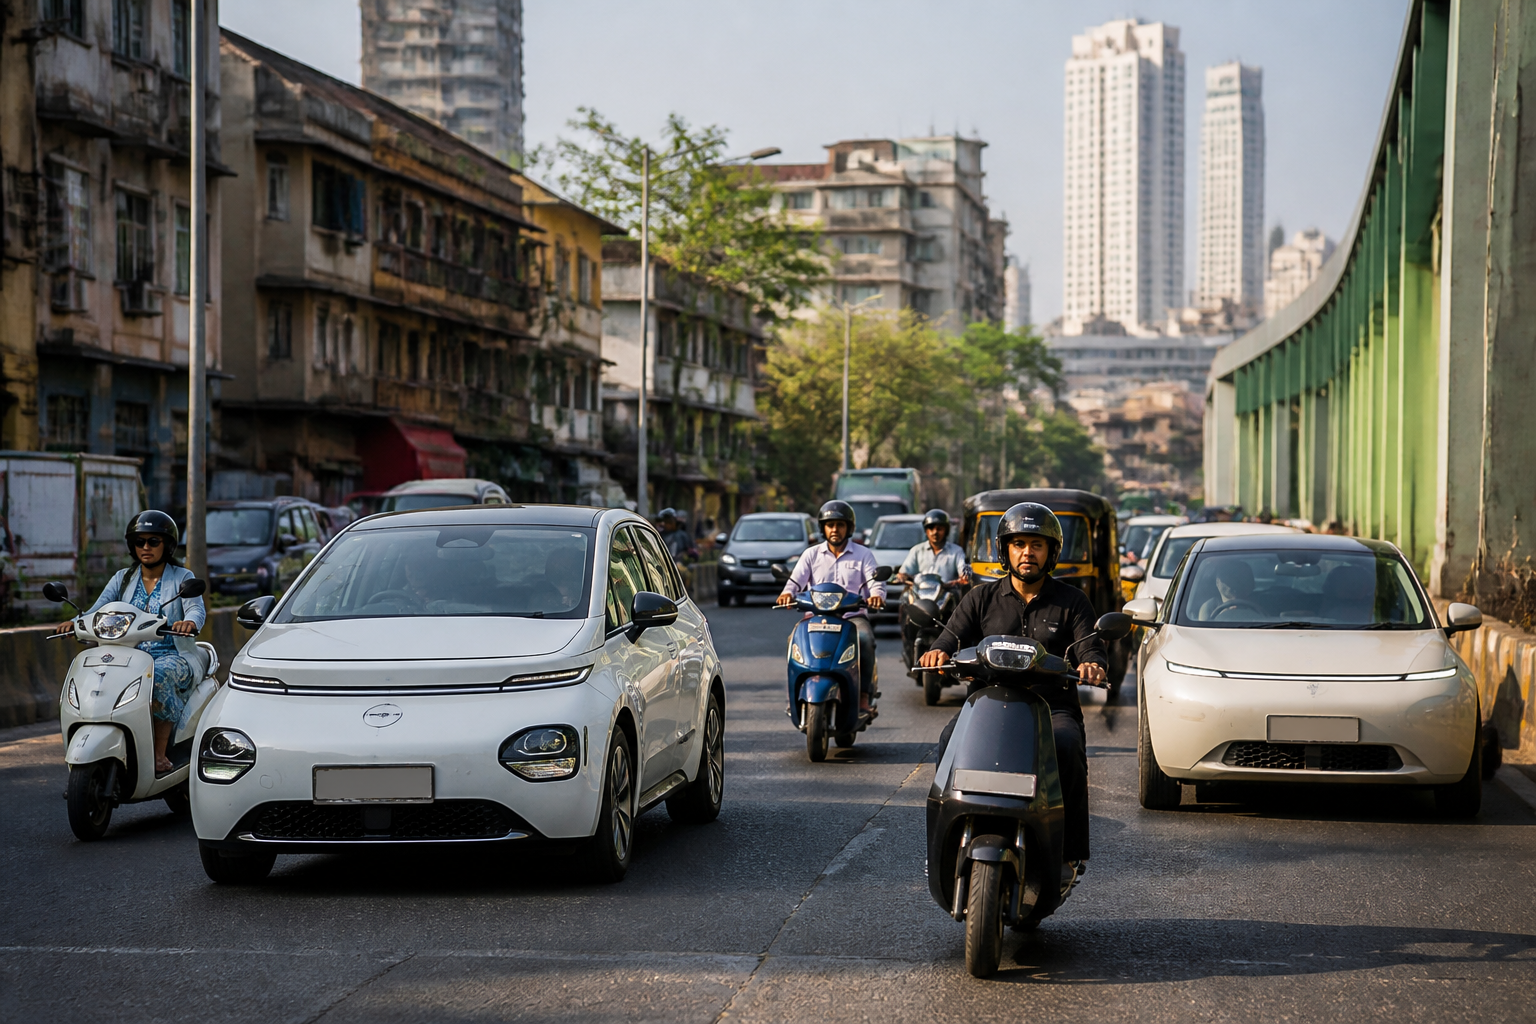
Mumbai’s electric vehicle fleet has crossed 77,000 registered vehicles, according to figures reported by the Times of India around World EV Day on September 9. Maharashtra, with an estimated 11.5 lakh electric vehicles, is now the second-largest state market in the country after Uttar Pradesh. The numbers mark a visible expansion of electric mobility, but they also raise a larger question: whether registration growth is being matched by the affordability, charging access and policy design needed to make electric transport a durable urban system.
The reported Mumbai total is 77,196 electric vehicles. E-bikes account for 40,086 of them, while e-cars number 30,137. The remaining vehicles fall into other electric vehicle categories. This composition is important because it shows that Mumbai’s electric mobility transition is not being driven by a single type of user or vehicle. Two-wheelers form the largest identified group, while electric cars represent a substantial share of the city’s registered fleet.
At the state level, the distribution is even more concentrated around two-wheelers. Maharashtra has around 11.5 lakh electric vehicles, including approximately 9.6 lakh e-bikes and more than 1 lakh e-cars. Uttar Pradesh is reported to have about 18 lakh electric vehicles, placing it ahead of Maharashtra, while Karnataka ranks third with around 9 lakh. The figures provide a broad national comparison, although the material available does not establish whether the states are using identical definitions, reporting periods or registration categories. That limitation matters when comparing the size of electric vehicle fleets across jurisdictions.
Even with that caveat, the state-level numbers show the central role of electric two-wheelers in adoption. E-bikes generally require a lower upfront investment than electric cars and occupy less road and parking space. Their growth can therefore expand electric mobility among households and delivery or commercial users without depending entirely on high-value car purchases. The available report does not provide a breakdown by private, commercial, fleet or shared mobility use, so it is not possible to determine how much of Maharashtra’s growth comes from household ownership, business fleets or institutional purchases.
Mumbai’s RTO-level distribution offers a more detailed view of where electric vehicles are concentrated within the city. Andheri has the largest combined count in the data cited, with 11,553 e-BOVs and 8,836 pure electric vehicles, giving it a total of 20,389. Borivli follows with 10,989 e-BOVs and 6,218 pure EVs, or 17,207 in total. Wadala records 8,830 e-BOVs and 8,860 pure EVs, while Tardeo has 13,608 e-BOVs and 8,302 pure EVs.
These figures indicate that electric vehicles are present across major regional transport office jurisdictions rather than being confined to one part of Mumbai. They also show why the category used in official data matters. The report separately identifies Mumbai’s e-bikes and e-cars, while the RTO comparison uses e-BOVs and pure EVs. Without a detailed explanation of how these categories overlap or differ, the RTO totals should be read as a reported distribution rather than a directly comparable breakdown of the citywide fleet.
The geography of registrations also points to the administrative character of electric mobility. Vehicle adoption is recorded through transport authorities, but the conditions that make electric vehicles useful are shaped by several other systems: household income, road networks, parking arrangements, electricity connections, charging facilities, building regulations and commercial mobility demand. The figures show where vehicles are registered. They do not, by themselves, show where vehicles are charged, how far they travel, or whether users can reliably operate them across Mumbai.
Maharashtra’s policy approach, as described in the report, relies on purchase incentives and subsidies to encourage adoption. Officials and industry observers have also pointed to lower battery manufacturing costs as a factor that could accelerate the market. A transport analyst from the Mumbai Mobility Forum said that stronger purchase incentives and subsidies, combined with lower battery manufacturing costs, could reduce vehicle prices and improve access to electric cars.
This policy mix addresses one of the clearest barriers to adoption: the initial purchase price. Electric vehicles can involve different operating and maintenance costs from conventional vehicles, but buyers must first absorb the upfront cost of the vehicle and, in some cases, the cost of charging equipment or electrical upgrades. The supplied material does not include comparative purchase prices, ownership costs, subsidy amounts or the duration of Maharashtra’s incentives. It therefore cannot establish how much of the reported growth is attributable to specific schemes.
The emphasis on battery manufacturing costs also reveals a second layer of the policy challenge. Electric vehicle adoption depends not only on demand-side support but also on the cost and availability of the main technology component. If battery prices decline, manufacturers may be able to offer more affordable vehicles. But the report does not provide battery cost data, manufacturing capacity figures or evidence showing how price changes have affected Mumbai registrations. Those links remain policy questions rather than established findings in the available material.
For Mumbai, the shift toward electric mobility has implications beyond vehicle registration. The city’s transport system must accommodate different vehicle types, users and charging requirements within a dense built environment. E-bikes may be easier to store than cars, but their widespread use still creates demands for safe parking, charging access and reliable electricity connections. Electric cars may reduce tailpipe emissions where they replace conventional vehicles, but the available report does not provide information on the energy mix used for charging, the number of charging stations or the extent to which EVs are replacing rather than adding to vehicle ownership.
That distinction is central to interpreting fleet growth. A larger electric vehicle population is evidence of adoption, but it is not a complete measure of mobility transition. The report establishes registration numbers and their broad distribution. It does not establish changes in total vehicle kilometres, congestion, emissions, fuel consumption or public transport use. Nor does it show whether electric vehicles are being adopted by existing motorists, new users or commercial operators. These indicators would be necessary to assess the wider urban effect of the transition.
The available data nevertheless points to a differentiated market. Maharashtra’s fleet is dominated by e-bikes, while Mumbai has more than 30,000 reported e-cars alongside more than 40,000 e-bikes. That difference may reflect the city’s income distribution, travel patterns, commercial activity and access to vehicle financing, but the supplied material does not provide evidence to rank those factors. It does show that electric mobility cannot be treated as a single market. Policies designed for electric cars may not address the needs of two-wheeler users, while measures for private vehicles may have limited relevance to commercial or shared fleets.
The RTO figures reinforce the need for more granular public data. Andheri’s combined reported count exceeds 20,000, while Borivli’s total exceeds 17,000. Wadala and Tardeo also record substantial concentrations, although their balance between e-BOVs and pure EVs differs. A useful next stage of reporting would require consistent information on vehicle category, registration year, ownership type, usage, charging location and retirement or transfer. Without those details, policymakers can track the size of the fleet but have less visibility into the infrastructure and services required to support it.
Maharashtra’s second-place national position gives the state a significant policy signal, but the ranking should not be mistaken for a complete performance assessment. A large fleet may reflect population, income, urbanisation, commercial demand, subsidy design or registration practices. The supplied report does not provide state-by-state population figures, adoption rates per household, charging infrastructure comparisons or annual growth rates. As a result, the ranking establishes scale, not necessarily the effectiveness of one state’s policy over another’s.
The broader urban question is whether registration growth can be converted into dependable, affordable and equitable mobility. Mumbai’s current figures confirm that electric vehicles have moved beyond a marginal presence on the city’s roads. They also show that two-wheelers are the main engine of Maharashtra’s adoption and that electric cars form a sizeable part of Mumbai’s fleet. What remains uncertain is how this fleet is used, supported and integrated into the city’s transport and electricity systems.
The next useful milestones will be more detailed official data on registrations, charging provision, vehicle use and the impact of incentives. For now, the evidence supports a clear conclusion: Maharashtra has achieved scale in electric vehicle adoption, and Mumbai is a significant part of that growth. The durability of the transition will depend on whether affordability, battery costs, charging access and administrative data develop alongside the rising fleet.
