


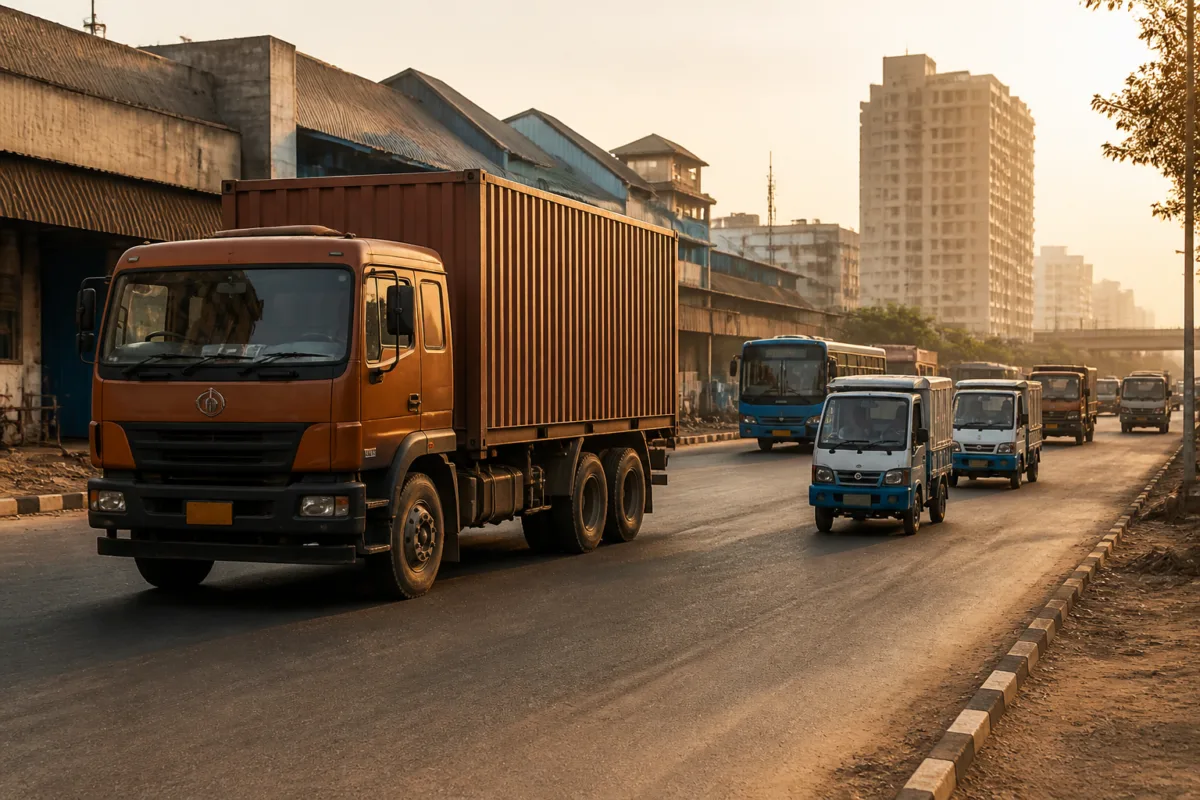
India’s commercial vehicle market is not moving in one direction. Goods carriers are benefiting from infrastructure, mining and freight activity, electric commercial vehicles are gaining a foothold in urban logistics, while buses are recording only marginal growth. The divergence is more than an industry sales pattern: it shows how the country’s transport system is prioritising the movement of goods even as public and shared passenger mobility struggles to keep pace.
VAHAN data cited in the BusinessLine report shows that goods-carrier registrations rose 21.4 per cent to 9.05 lakh between January and October 2026, compared with 7.45 lakh during the same period a year earlier. Bus registrations increased only 1.8 per cent to 1.13 lakh. In October alone, overall commercial-vehicle retail sales rose 2.29 per cent to a record 1,15,140 vehicles, but the headline number conceals sharply different outcomes across segments.
Heavy commercial vehicles led the expansion. Heavy commercial-vehicle registrations increased 28.95 per cent to 36,879 units in October, while medium commercial vehicles grew 21.16 per cent to 9,042 units. Light commercial vehicles moved in the opposite direction, declining 9.57 per cent to 69,148 units. The pattern suggests that demand is strongest where vehicles are tied to longer-distance freight, infrastructure-linked haulage and industrial movement, rather than being evenly distributed across the logistics chain.
That distinction matters for cities. Heavy trucks are generally associated with inter-city and industrial freight, but their growth affects urban life through the terminals, roads, warehouses and last-mile networks that connect production centres to consumers. A rise in freight vehicles can indicate economic activity, yet it can also increase pressure on road space, loading infrastructure and the management of goods movement within and around urban areas. The supplied data does not establish the effect on congestion or emissions, but it clearly points to a transport market being shaped by freight demand rather than by a balanced expansion of all commercial mobility.
The electric commercial-vehicle segment is growing from a much smaller base, but its pace is significant. Electric commercial-vehicle registrations surged 162.3 per cent to 4,942 units in October, accounting for 4.29 per cent of total commercial-vehicle retail sales. Tata Motors recorded 1,740 registrations and a 35.2 per cent share, followed by Euler Motors with 1,272 vehicles and a 25.7 per cent share. Mahindra Last Mile Mobility ranked third with 538 registrations and a 10.9 per cent share. Together, the three companies accounted for nearly 72 per cent of electric commercial-vehicle registrations.
The numbers show both momentum and concentration. Electric commercial vehicles are expanding fastest in the part of the market connected to urban logistics and last-mile movement, but the segment remains relatively small compared with the conventional freight market. A 4.29 per cent share means that the transition is visible without yet being broad-based across commercial transport. The concentration among three manufacturers also indicates that market development is being led by a limited group of companies rather than by a wide industry-wide shift.
The bus market presents the clearest counterpoint. Bus registrations rose only 1.8 per cent during January-October, and several company-level figures in October were weaker. Ashok Leyland’s bus volumes declined 11.3 per cent to 2,314 vehicles, while Volvo Eicher Commercial Vehicles also reported a decline in domestic bus volumes. Tata Motors led bus registrations during the first ten months with 36,656 vehicles, ahead of Force Motors and Ashok Leyland. Some categories remained resilient: SML Mahindra’s passenger-vehicle volumes increased 17 per cent to 7,339 vehicles, according to the report.
The uneven bus performance raises an institutional question about the relationship between vehicle demand and public transport capacity. The data records registrations and dispatches, not the quality or availability of bus services in individual cities. It therefore cannot by itself explain whether the slower growth reflects weak fleet procurement, financial constraints among operators, changing demand or other factors. It does show, however, that the recovery visible in freight vehicles has not been matched by a comparable increase in buses.
This gap is important because buses perform a different urban function from freight trucks and electric cargo vehicles. A commercial vehicle market can expand while public transport provision remains relatively flat. If investment and procurement are concentrated in freight-linked segments, cities may see stronger logistics capacity without a corresponding strengthening of shared mobility. The BusinessLine figures do not establish a direct causal link between these outcomes, but they reveal that the two sides of urban movement are currently following different cycles.
The market is also becoming more segmented within freight. Ashok Leyland’s medium and heavy truck dispatches rose 40.6 per cent in October to 11,613 vehicles, while its light commercial-vehicle dispatches increased 14.5 per cent to 7,961. The company’s bus volumes fell at the same time. Its decision to widen its cargo portfolio reflects an effort to balance heavy-truck cycles with light commercial-vehicle opportunities. Sanjeev Kumar, the company’s chief marketing officer, indicated that expanding light commercial-vehicle volumes could provide greater stability as heavy-truck demand moves through cycles.
That diversification is a response to the uneven structure of demand. Tata Motors remained the market leader in October commercial-vehicle retail sales with 39,914 registrations, up 11.2 per cent, giving it a 34.67 per cent share. During January-October, it led goods-carrier registrations with 3.06 lakh vehicles and a 33.8 per cent share, followed by Mahindra at 2.50 lakh and Ashok Leyland at 1.65 lakh. Tata’s wholesale dispatches rose 27 per cent to 47,652 vehicles, supported by a 225 per cent increase in international sales, while domestic volumes grew 13 per cent.
The competitive figures show why manufacturers are building portfolios across heavy trucks, light cargo vehicles, buses and electric platforms. A company exposed mainly to one segment remains vulnerable to changes in infrastructure activity, freight movement or passenger-carrier demand. Volvo Eicher’s October dispatches rose 34.9 per cent to 10,861 vehicles, while Mahindra’s truck and bus division reported an 82 per cent increase to 1,773 vehicles, including more than double the cargo volumes at 1,504 vehicles. SML Mahindra’s dispatches were largely flat at 1,065 vehicles, and its domestic sales fell 3.7 per cent.
FADA President Sai Giridhar said commercial vehicles, three-wheelers and tractors recorded their best-ever October retail volumes. Dealers identified infrastructure, mining and freight movement as key demand drivers, while 50.41 per cent expected further commercial-vehicle growth during November-January. SML Executive Chairman Vinod Sahay similarly attributed growth to festive demand, freight movement and infrastructure activity, while flagging input-cost pressures. These statements provide an industry explanation for the freight upturn, but they also show that the market remains sensitive to the pace of infrastructure and economic activity.
The urban policy landscape implied by these figures is therefore divided across institutions and uses. VAHAN provides the registration picture; FADA represents dealer-level sentiment; manufacturers report dispatches and segment performance. None of these indicators alone measures the adequacy of urban freight infrastructure, bus availability, charging access or the operating economics of electric fleets. The absence of those measures is important: rising registrations do not automatically translate into improved mobility outcomes.
For cities, the most significant signal is the emergence of three separate commercial-vehicle trajectories. Heavy trucks are responding to infrastructure and industrial freight. Smaller cargo vehicles are facing uneven demand, even though they remain central to distribution within urban areas. Electric commercial vehicles are gaining ground in urban logistics, but from a limited base and with registrations concentrated among a few manufacturers. Buses, meanwhile, are growing much more slowly than goods carriers.
This is not simply a question of which vehicle manufacturers are gaining market share. It is a question of what kind of urban movement the economy is currently rewarding. The supplied evidence confirms strong freight momentum and a rapidly expanding electric niche. It also confirms that bus growth is weak by comparison. What it does not establish is whether the gap will narrow, whether electric adoption will extend beyond selected logistics applications, or how cities are preparing roads, depots and charging systems for these changing vehicle patterns. Those are the next indicators that will determine whether commercial-vehicle growth becomes a broader improvement in urban mobility or remains primarily a freight-led expansion.