


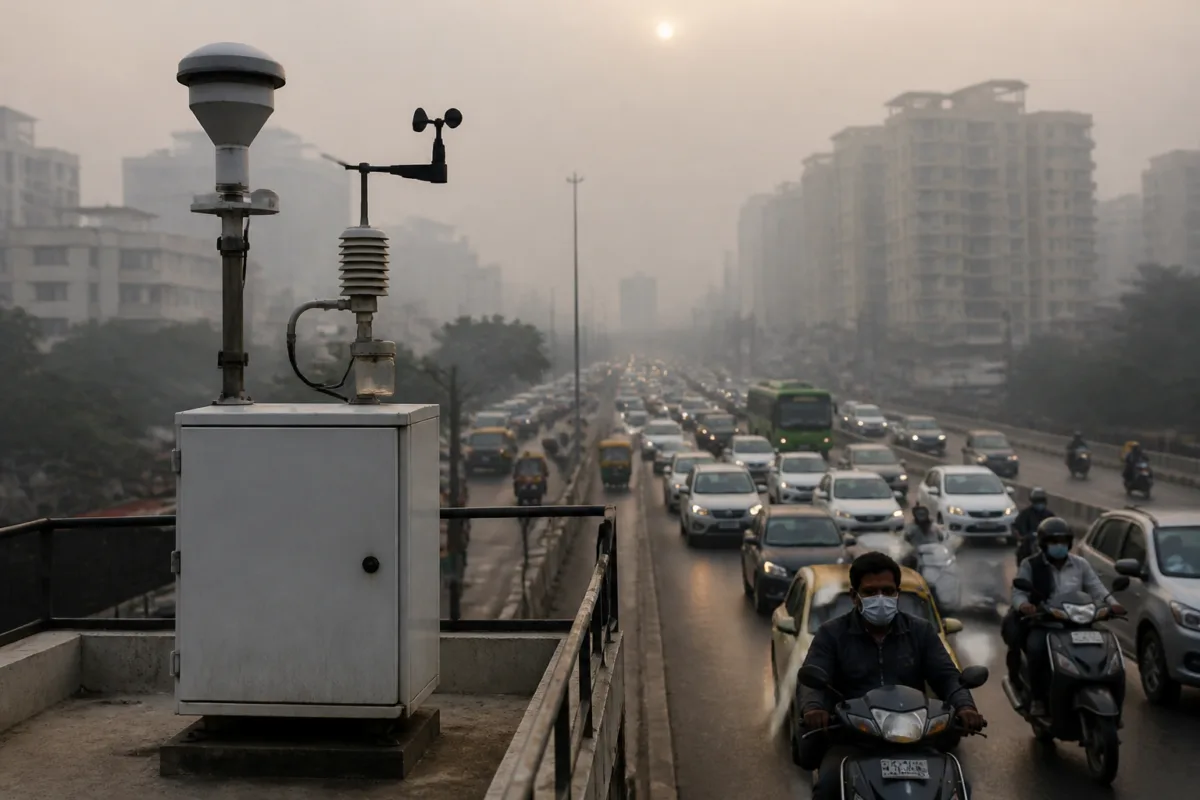
Delhi’s Diwali pollution readings did not tell a single, consistent story. The Central Pollution Control Board’s 24-hour average placed the city’s Air Quality Index at 370, while private platforms reported substantially higher values, including readings close to or above 1,000 on different scales. The divergence was not simply a disagreement between websites. It reflected three separate problems: different AQI formulas, a national scale that ends at 500, and a monitoring network that stopped supplying data at the very time pollution was believed to be at its peak.
That combination matters because an AQI number is not only a public information product. It also shapes how residents understand risk and how authorities decide whether emergency action is necessary. When the most polluted hours are absent from the official record, the city may still publish a technically valid average while providing an incomplete account of the exposure people experienced overnight.
The supplied reports describe this year’s Diwali as Delhi’s most polluted in five years. The city recorded an AQI of 376 the following day, while a reading of 371 was reported at 10 am on Monday. The previous comparable high cited in the report was an AQI of 382 on Diwali in 2021. Several monitoring stations recorded levels above 400, a range classified as severe under India’s official system.
The first issue is that the figures being compared are not necessarily measuring pollution in the same way. The Indian official AQI system, as explained in The Indian Express report, ends at 500. That does not mean pollutant concentrations stop increasing once the index reaches 500. It means the official index no longer displays additional gradations beyond that ceiling. International or private platforms may use different pollutant thresholds and calculation methods, allowing their readings to rise above 500.
This is why a CPCB reading of 370, a private Indian-platform reading of 787, and a United States-scale reading of 955 cannot be read as identical measurements expressed in different fonts. They may be based on related pollutant data but converted through different standards. The underlying concentration, averaging period, pollutant selection and index scale can all affect the final number. The public sees one label—AQI—but the institutions producing it may be answering slightly different measurement questions.
The reports also point to a second and more consequential problem: missing observations during the critical period. According to the supplied account, seven stations, including Nehru Nagar and Pusa (IITM), had no PM2.5 data between 10 pm and 6 am. The same period covered the peak hours of firecracker use described in the reports.
The number of stations without available data increased through the night. At 7 pm, only one monitoring station was not providing data. By 10 pm, the number had risen to seven; by 11 pm, it had reached 23. At midnight, 29 stations were not reporting. The figure rose to 36 at 1 am, remained at 35 at 2 am, then declined to 30 at 3 am, 20 at 4 am, 19 at 5 am and 16 at 6 am.
Those gaps have a direct effect on the official citywide picture. The report states that 16 hours of readings are required to calculate the average AQI. Stations that did not provide enough data were therefore excluded from the city average. That is a defensible calculation rule if the objective is to avoid producing an average from insufficient observations. But it also creates a serious representational problem when the stations excluded are missing data during the hours when pollution may have been highest.
In other words, data quality and data completeness are not the same thing. A citywide average can be calculated correctly from the stations that remain available while still failing to capture the full spatial and hourly distribution of pollution. The absence of a reading is not proof that pollution was higher at that location. It does, however, make the citywide figure less complete and raises questions about whether the monitoring network was resilient during a predictable high-risk event.
The timing of the outages is central. The supplied report says that stations progressively stopped providing data as the night advanced and that several were offline during the peak period of fireworks. This does not establish why each station stopped reporting. The Delhi government’s cabinet minister, Kapil Mishra, said at a press conference that he would seek action on the issue and requested details of the stations that were not functioning. That response indicates that the reason for the outages had not been publicly resolved in the material supplied.
The distinction between malfunction, interruption, maintenance and deliberate data suppression must therefore be maintained. The reports include an allegation by senior Aam Aadmi Party leader Saurabh Bharadwaj that the Delhi government manipulated AQI figures to show lower pollution levels. That allegation is political and is not independently established in the supplied material. What is established is that multiple stations failed to provide data during the most important window and that the missing observations affected which stations entered the city average.
Private platforms produced a different picture, but those readings also require careful interpretation. IQAir reported an AQI of 245 at 8.30 am using the United States scale, a level described in the report as very unhealthy. AQI.in reported Delhi’s AQI at 637 on Monday morning and said the index had reached 2,283 after Diwali. The Indian Express separately reported an AQI.in reading of about 955 under US standards and 787 under Indian standards.
These figures demonstrate the effect of scale conversion, but they do not automatically settle which platform provides the most accurate description of personal exposure. A private platform may offer a higher-resolution index or use a different averaging method, while the official system may be the legally recognised basis for public advisories. The important institutional failure is not merely that the numbers differ. It is that the public is given too little explanation about what each number represents and why one figure should guide health or emergency decisions.
Anumita Roychowdhury, executive director of the Centre for Science and Environment, said the inability of the monitoring network to provide real-time data was difficult to understand. She argued that accurate advice and emergency measures depend on real-time information. Her observation identifies the link between monitoring infrastructure and governance: sensors are not passive devices at the edge of administration. They are part of the system through which authorities decide when conditions have crossed a danger threshold.
This makes the monitoring network a form of urban infrastructure. Its value depends on coverage, uptime, maintenance, transmission systems, quality control and transparent publication. A station that works on ordinary days but fails during an extreme pollution episode is not providing the same public value as one that remains operational during the event that most requires measurement. The network’s performance must therefore be assessed not only by the number of stations installed but also by their availability during high-risk periods.
The episode also exposes a gap between technical compliance and public accountability. Excluding stations with insufficient data may protect the formal integrity of the average, but the process must be visible to residents. A credible public dashboard should show how many stations are active, which stations are missing, the hours affected, the pollutants recorded and the method used to calculate the reported figure. Without that information, a single citywide number can conceal the conditions under which it was produced.
The policy responsibility is divided across measurement, interpretation and response. The CPCB provides the official national framework and citywide AQI data cited in the report. Monitoring stations generate or transmit observations. Private platforms interpret pollutant data through their own standards. The Delhi government is responsible for responding to operational failures within the state’s administrative sphere and for explaining what happened. The reports do not establish the precise responsibility of each agency for every offline station, which is itself an important unanswered administrative question.
There is also a communication challenge. Residents comparing official and private readings may believe that one side is necessarily falsifying information, when some of the difference arises because the indices are not directly comparable. At the same time, technical explanations cannot be used to dismiss the significance of missing data. Different scales explain why AQI values may diverge; they do not explain why monitoring stations stopped reporting during the night or whether the missing period altered the citywide picture.
The numbers supplied in the reports show the scale of the information gap. The number of non-reporting stations rose from one at 7 pm to 36 at 1 am, before falling to 16 by 6 am. The official citywide average was based only on stations with sufficient data, while private platforms reported much higher peaks. The result was not simply a difference between 370 and 955. It was a disagreement over the measurement framework, the time window, the data included and the meaning of the final index.
For Delhi’s residents, the practical consequence is uncertainty at the moment when clear information is most necessary. People need to know whether a reported AQI is a citywide average, a station-level peak, an index capped at 500 or a value calculated on another scale. They also need to know whether the data covers the hours of greatest pollution. Without those details, an official number may be technically correct but insufficient for understanding actual conditions across the city.
The evidence currently confirms three things. Delhi experienced exceptionally high pollution around Diwali, several monitoring stations did not provide data during critical overnight hours, and official and private platforms used different methods that produced sharply different AQI values. It does not establish that the outages were deliberate or that any agency manipulated the data. The next questions are operational and documentary: why the stations went offline, how missing stations were excluded, whether the network has redundancy, and what corrective action follows from the government’s request for station details. Until those questions are answered, Delhi’s pollution numbers will remain difficult to interpret precisely when the city needs them most.