


The Aspirational Districts Programme has produced measurable improvements in all eight participating districts of Uttar Pradesh, but the numbers also reveal the limits of judging development through composite scores alone. The programme’s larger significance lies in how it has changed district administration: from tracking expenditure and broad targets to monitoring specific outcomes across health, education, agriculture, financial inclusion, skills and basic infrastructure.
Launched in January 2018, the programme was designed for districts that had fallen behind on important social and economic indicators. Eight districts in Uttar Pradesh—Bahraich, Balrampur, Chandauli, Chitrakoot, Fatehpur, Shravasti, Siddharthnagar and Sonbhadra—were included among 112 districts nationally. Figures cited in a Lok Sabha answer in August 2026 show that each of the eight recorded a higher composite development score in March 2026 than its June 2018 baseline.
That result is significant because the programme measures change from where a district started rather than ranking districts only by their current level of development. Siddharthnagar recorded the largest improvement, with its score rising from 35.70 in June 2018 to 64.84 in March 2026, an increase of 82 per cent. Sonbhadra rose from 38.00 to 67.06, while Bahraich moved from 37.40 to 65.63. Shravasti’s score increased from 37.10 to 61.11, and Balrampur’s from 36.00 to 58.37.
The remaining districts also registered gains. Fatehpur’s score increased from 41.00 to 65.62, Chandauli’s from 42.40 to 66.42, and Chitrakoot’s from 44.70 to 67.48. The figures show that districts with different starting points were able to demonstrate progress within the same administrative framework. They do not, however, establish that household incomes or overall living standards increased by the same percentages.
That distinction is central to understanding what the programme can and cannot prove. A composite score is a measurement tool built from selected indicators. It can show that performance across those indicators has improved, but it cannot by itself establish whether residents are receiving better-quality healthcare, whether children are learning more effectively, whether farmers have higher and more stable incomes, or whether public infrastructure is functioning reliably.
The programme’s institutional innovation is its emphasis on convergence, collaboration and competition. NITI Aayog coordinates with central ministries, state governments, district administrations and development partners. The Champions of Change Dashboard tracks 49 key performance indicators across five broad themes: health and nutrition; education; agriculture and water resources; financial inclusion and skill development; and basic infrastructure.
This arrangement attempts to make district administration more specific. Instead of treating development as a general question of spending, officials can identify a shortfall in immunisation, school facilities, agricultural services, banking access or infrastructure and direct departmental attention towards it. The use of delta rankings also gives districts starting from lower levels a way to demonstrate improvement, while retaining pressure to continue closing service gaps.
For health and nutrition, the framework focuses on maternal healthcare, antenatal registration, supplementary nutrition, childhood immunisation and the functioning of frontline facilities. In districts such as Bahraich, Shravasti and Balrampur, where access to public services remains an important development concern, such indicators can help identify underserved communities and missed service targets.
But monitoring coverage is not the same as measuring care. The establishment of facilities or registration of beneficiaries does not automatically demonstrate better health outcomes. Staffing, medicine availability, regular supervision and the quality of treatment remain decisive factors. The programme’s data system can identify where attention is required; it cannot by itself ensure that the service delivered at the last mile is adequate.
The same issue applies to education. The indicators bring attention to school infrastructure, electricity, textbooks and other conditions that influence participation. These are essential foundations, especially where distance and inadequate facilities create barriers to schooling. Yet improved access does not necessarily mean improved learning. The material supplied in the report does not provide learning-outcome data, so the effect of the programme on classroom performance cannot be established from the composite scores alone.
The connection between education, skill development and livelihoods is also important for the programme’s urban and regional-development implications. Access to banking, credit and livelihood opportunities affects how households participate in the formal economy. In rural Uttar Pradesh, agriculture and water resources remain central to economic security. Better coordination among departments may address practical constraints, but the report does not provide evidence that the programme has produced a specific increase in farm productivity, irrigation reliability or household income.
Basic infrastructure gives the programme a direct built-environment dimension. Reliable electricity, drinking water, sanitation and road connectivity influence access to schools, health facilities, markets and public offices. They also affect whether local enterprises can operate efficiently. These services are often treated as separate departmental responsibilities, but from a resident’s perspective they form a connected system. A road affects access to a health centre; electricity affects schooling and enterprise; water and sanitation affect public health.
The shift from districts to blocks is therefore one of the most important developments in the programme. The Aspirational Blocks Programme, launched in January 2023, was intended to address differences within districts by focusing on underserved sub-districts. District-level averages can conceal major variations between better-connected centres and remote villages. Block-level monitoring brings the administrative unit closer to the location where public services are actually delivered.
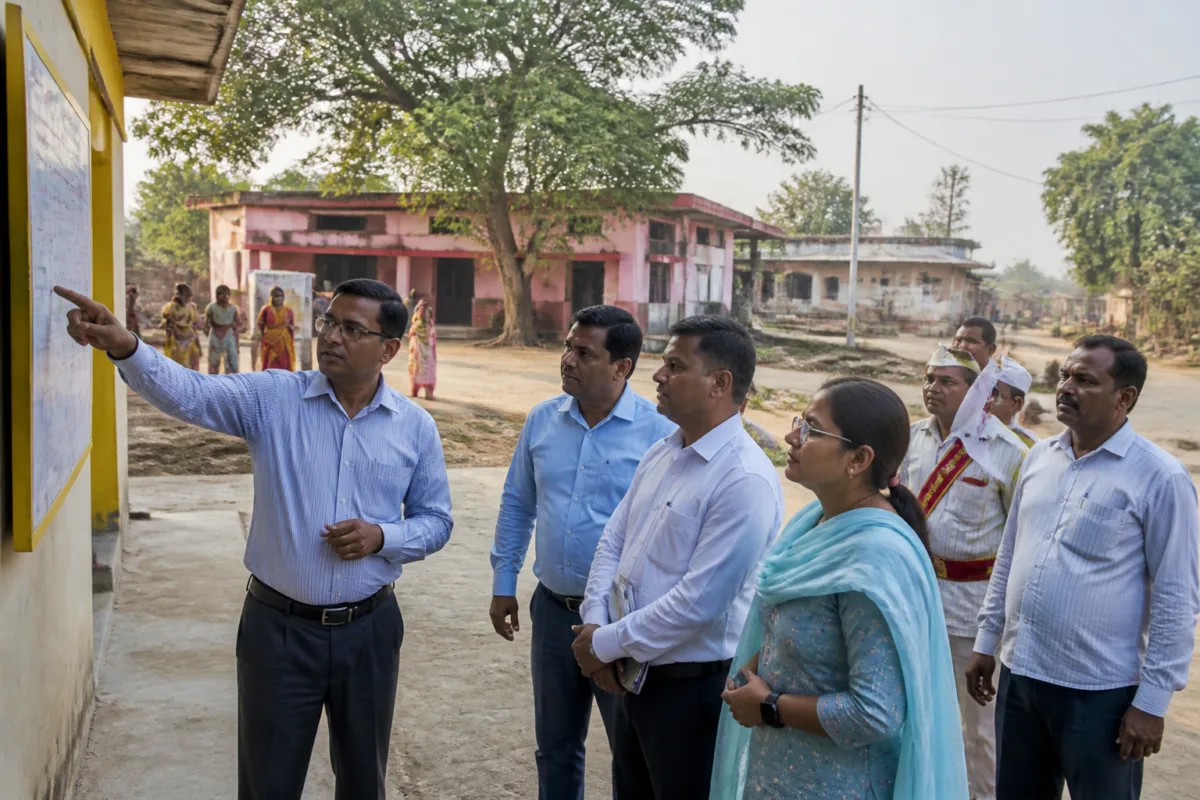
A Uttar Pradesh review in June 2025 illustrates the scale of this approach. Officials inspected 272 schools, 301 Anganwadi centres, 232 health units, 229 gram panchayat secretariats and 275 other institutions across 108 aspirational development blocks. The review also reported 497 active farmer producer organisations and 6,595 Banking Correspondent Sakhis. According to the state government’s report, 106 blocks had achieved their targets under the Block Development Strategy.
These numbers demonstrate administrative activity and the breadth of monitoring. They do not, on their own, establish whether inspected facilities were adequately staffed, whether services were consistently available or whether residents experienced a sustained improvement. The distinction matters because inspection is an input into administration, while service quality is an outcome for citizens.
The block model also highlights a recurring governance problem: the gap between data visibility and institutional capacity. A dashboard can make a problem easier to identify, but solving it may require filling vacant posts, maintaining infrastructure, coordinating departments and ensuring that funds and personnel reach the intended location. The state review included scrutiny of vacant posts, scheme implementation and monitoring practices, suggesting that the programme is being used to connect performance information with administrative action.
The national Sampoornata Abhiyan 2.0, launched in January 2026 for a three-month period ending on April 14, 2026, reinforced this focus on saturating selected indicators in aspirational districts and blocks. Its priorities included maternal and child health, tuberculosis case notification, health and nutrition outreach, functional facilities at Anganwadi centres and schools, and vaccination of bovine animals. This approach moves beyond broad improvement and towards achieving specified coverage targets.
That target-based model can be useful where persistent gaps are identifiable and administrative responsibility is clear. It also creates a risk of narrowing attention to what is easiest to count. A facility may be recorded as functional while facing staffing shortages; a beneficiary may be registered without receiving reliable support; and infrastructure may be reported as completed without adequate maintenance. The evidence supplied does not show that these failures occurred in the eight districts, but it establishes why composite progress must be read alongside individual indicators and ground-level service conditions.
The programme’s eight-year record therefore presents two conclusions at once. First, measurable improvement is possible when district administrations work against a common framework, compare progress from a baseline and focus on specific gaps. Second, improvement in a score is not the final measure of development. The more demanding test is whether better performance indicators correspond with healthier mothers and children, stronger schools, productive farms, accessible financial services and dependable infrastructure.
For Uttar Pradesh, the next phase will depend on whether the district model can sustain gains while the block model reduces inequalities within districts. The evidence currently confirms broad improvement in composite scores and a substantial expansion of administrative monitoring. It does not establish the full quality or durability of outcomes for residents. That makes service continuity, staffing, infrastructure maintenance and differences between connected and remote communities the key areas to monitor as the programme moves beyond measurement and towards lasting development.