


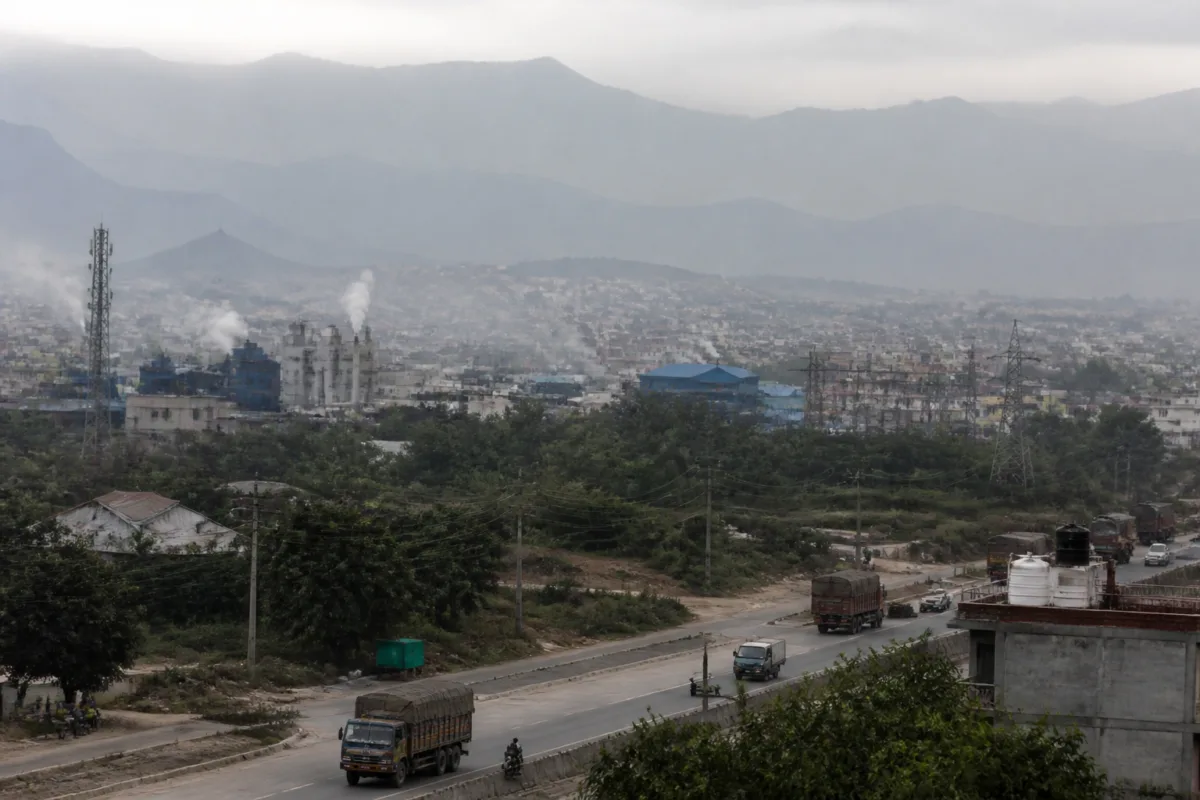
Himachal air pollution worsened sharply in industrial and lower-altitude towns during Diwali, with Parwanoo recording the state’s only poor Air Quality Index (AQI) reading even as hill stations such as Shimla and Manali remained in the satisfactory category. The pattern, recorded in data released by the Himachal Pradesh State Pollution Control Board (HPSPCB) for November 8, shows that the state’s air-quality problem is shaped less by its mountain identity than by the location of industry, settlements and pollution sources.
Parwanoo, in Solan district, recorded an AQI of 219, placing it in the poor category under the National Air Quality Index prescribed by the Central Pollution Control Board. Baddi followed with an AQI of 180, while Una and Paonta Sahib each recorded 171, all in the moderate category. Of Himachal Pradesh’s 12 monitoring stations, seven recorded moderate air quality, four were in the satisfactory category and only Parwanoo entered the poor category.
The figures matter because they challenge a broad assumption that Himachal Pradesh’s terrain automatically protects its towns from severe pollution. The monitoring data instead shows substantial variation between locations. Industrial and lower-altitude areas recorded higher pollution levels, while the state’s better-known hill stations reported comparatively lower AQI readings. That difference places local land use, industrial activity and settlement patterns at the centre of the air-quality discussion.
The concentration of high readings in and around Solan district is particularly significant. Parwanoo recorded PM10 particulate matter at 269 micrograms per cubic metre and PM2.5 at 89 micrograms per cubic metre. Baddi reported PM10 at 145 micrograms per cubic metre and PM2.5 at 84 micrograms per cubic metre. These readings show that the AQI result was accompanied by elevated concentrations of both larger and finer particulate matter.
Una, another lower-altitude urban location, reported PM10 at 207.2 micrograms per cubic metre and PM2.5 at 68.6 micrograms per cubic metre. Paonta Sahib recorded PM10 at 147.7 micrograms per cubic metre and PM2.5 at 81.3 micrograms per cubic metre. Taken together, the figures indicate that pollution was not restricted to one industrial town or one district. Several locations with industrial, commercial or lower-altitude urban characteristics recorded higher particulate concentrations than the hill stations listed in the HPSPCB data.
Baddi’s position also adds an important temporal layer to the reading. Although Parwanoo recorded the highest AQI on November 8, Baddi had reported higher AQI readings of 227 and 190 on November 6 and November 7 respectively. Baddi is described in the supplied report as the state’s most polluted industrial town. Its readings suggest that the Diwali result should not be treated as an isolated ranking alone. Pollution conditions had already been elevated in the industrial belt before the November 8 measurement.
The data therefore points to two overlapping questions. The first concerns the short-term festival-related pollution episode. The second concerns the underlying baseline in towns where industrial activity and urban growth already create higher exposure. A single Diwali reading cannot establish how much of Parwanoo’s AQI was caused by fireworks, industrial emissions, traffic, weather or the interaction of these factors. It can, however, identify where the monitoring system recorded the greatest burden on that date and which locations require closer attention across multiple days.
The contrast with the hill stations is stark. Manali recorded an AQI of 70 and Shimla 66, both in the satisfactory category. Kala Amb also remained satisfactory at 58, while Nalagarh recorded 97. Other stations in the moderate category included Dharamshala at 117, Sundernagar at 111, Barotiwala at 109 and Damtal at 101. The spread runs from 58 at Kala Amb to 219 at Parwanoo, a difference of 161 AQI points across the monitoring network.
That range demonstrates why state-level averages or a single description of Himachal Pradesh’s air quality can conceal local exposure. Residents in Shimla, Manali and Parwanoo did not experience the same air environment on the same day. For urban administration, this makes station-level reporting more useful than a generalised statement that the state had either clean or polluted air. It also makes the placement, continuity and interpretation of monitoring stations important parts of environmental governance.
The AQI categories provide the framework for interpreting these differences. Under the CPCB scale cited in the report, readings from 0 to 50 are classified as good, 51 to 100 as satisfactory, 101 to 200 as moderate, 201 to 300 as poor, 301 to 400 as very poor and readings above 400 as severe. Parwanoo’s 219 therefore crossed into poor air quality, while Baddi, Una and Paonta Sahib remained moderate despite their high particulate readings.
The category labels are useful for public communication, but the particulate numbers add detail that the headline AQI alone does not provide. Parwanoo’s PM10 level of 269 micrograms per cubic metre was substantially higher than its PM2.5 level of 89. In Baddi, PM10 stood at 145 and PM2.5 at 84. Una recorded a higher PM10 level than Baddi at 207.2, while Paonta Sahib recorded PM2.5 at 81.3. These differences show that towns can have different particulate profiles even when they fall within the same broad AQI category.
This is also an institutional question. The HPSPCB data gives residents and authorities a location-wise snapshot, but the supplied material does not establish the source contribution of fireworks, factories, vehicles, construction activity or weather conditions. Nor does it provide a longer time series for all 12 stations. Without that information, the data cannot by itself determine which source was responsible for the readings or whether the November 8 pattern represented an exceptional spike or a recurring condition.
That limitation is important for policy. If monitoring is used only to publish a ranking after a festival, it may inform residents without explaining what interventions are required. If the same stations are tracked before, during and after high-pollution episodes, the resulting record can better distinguish temporary events from persistent local pollution. The comparison of Baddi’s November 6 and 7 readings with the November 8 figures shows the value of such continuity, even though the supplied report does not provide a complete trend for every station.
The geography of the readings also places industrial towns at the centre of Himachal Pradesh’s air-quality challenge. Baddi and Parwanoo are not merely points on a state pollution map; they are urban and industrial locations where employment, freight movement, manufacturing and residential settlement exist alongside environmental exposure. The available data does not quantify the population affected or identify specific facilities, but it does show that the highest recorded AQI was located in an industrial belt rather than in one of the state’s principal hill destinations.
For citizens, the immediate significance is local. A resident in Parwanoo faced a different air-quality category from one in Shimla or Manali. For municipal and state authorities, the wider issue is whether pollution management is designed around the most visible seasonal event or around the everyday conditions of industrial and lower-altitude settlements. The evidence supplied here supports the second question, but does not provide enough information to assess the adequacy of existing enforcement or mitigation measures.
The November 8 readings confirm a sharply uneven pollution landscape across Himachal Pradesh. Parwanoo was the only monitoring station in the poor category, while Baddi, Una and Paonta Sahib recorded the highest moderate readings and hill stations remained satisfactory. What remains uncertain is the precise contribution of individual pollution sources and whether these readings reflect a recurring baseline. Continued station-level monitoring and comparable data across dates will be necessary to establish that distinction.