


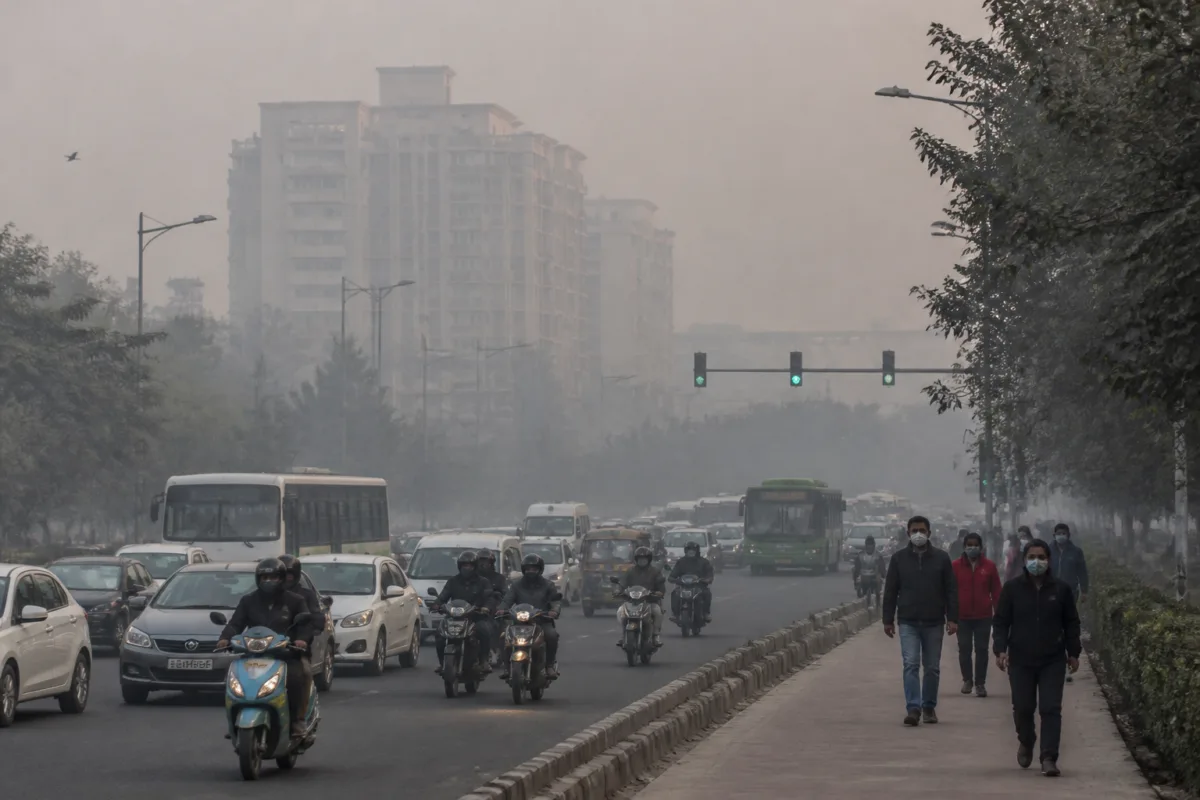
Delhi’s pollution season has entered the period that has historically produced the capital’s worst air quality, exposing how several separate urban and regional emission sources converge when winter weather prevents pollutants from dispersing. An analysis of Central Pollution Control Board data by The Times of India found that November 1-15 has recorded the highest average Air Quality Index of any fortnight in the year, at 374, with a high number of severe-air days.
The timing matters because the fortnight is not defined by one source of pollution. Farm fires generally increase around this period, festival and wedding-related traffic adds to local emissions, firecrackers can raise the pollution load, and falling temperatures, calm winds and atmospheric inversion can trap pollutants close to the ground. Together, these conditions turn Delhi and the wider National Capital Region into a connected airshed in which emissions generated in different places affect the same population.
This makes the annual debate over the relative contribution of individual sources less useful unless it is accompanied by real-time information on what is changing on the ground. Anumita Roychowdhury, executive director for research and advocacy at the Centre for Science and Environment, said Delhi had entered its most difficult winter phase. She said seasonal farm and waste fires, local traffic emissions, industrial combustion and festive firecrackers could combine to create a hotspot, while forecasting gross pollution and source emissions remained challenging.
Her assessment points to an institutional problem: Delhi’s air cannot be managed only within the city’s administrative boundary. The pollution episode is shaped by regional agricultural activity, waste burning, industrial emissions, road traffic and weather conditions. Yet responsibility for these sources is distributed across different authorities and jurisdictions. The need to track action and emission changes across Delhi and the NCR therefore becomes as important as measuring the final AQI reading.
## The data identifies a recurring risk window
The CPCB began calculating the AQI in April 2015. The TOI analysis of data from 2015 onwards identifies November 1-15 as the capital’s most polluted fortnight, with an average AQI of 374. The next most polluted period is December 16-31, with an average AQI of 346. January 1-15 follows, with an average AQI of 329.3 between 2016 and 2026.
The pattern is not confined to the first half of November. The November 16-30 period has an average AQI of 329, while October 16-31 records an average of 281 as winter conditions begin to set in. The figures show that the city’s pollution emergency is not a single-day or single-festival phenomenon. It is a seasonal sequence in which meteorology and human activity repeatedly increase exposure risk over several months.
The data also shows why averages alone do not describe the full public-health experience. Last year, the November 1-15 period recorded three severe days, defined by an AQI above 400 on the CPCB’s scale of 500. Delhi recorded eight severe days in November 2024, including two in the first half of the month. In 2023, six severe days were recorded during November 1-15.
The second half of December presents a similar risk. Last year, that period recorded five severe days, including a severe-plus day when the AQI reached 461. The recurrence of severe episodes across different years suggests that the city’s winter air problem is structurally embedded in the seasonal urban system, even when the intensity of a particular year varies.
## Why weather changes the pollution problem
The arrival of winter does not create all the emissions, but it changes how long they remain in the air that residents breathe. Low temperatures, calm winds and atmospheric inversion can prevent pollutants from dispersing vertically and horizontally. Dense fog later in the season can further compound the problem by trapping pollutants near the surface.
This interaction explains why the same traffic volume or industrial activity can have different consequences at different times of the year. During the winter pollution season, emissions that might otherwise disperse can accumulate near roads, homes, workplaces and public spaces. The result is a citywide exposure problem rather than a localised nuisance around one source.
The urban implications are especially significant because traffic increases during festivals and the wedding season. More vehicles mean greater congestion and longer periods of idling and movement on already crowded roads. The supplied evidence does not establish the precise contribution of traffic, farm fires, firecrackers or industrial combustion during the current fortnight. It does, however, show that these sources overlap during the period when weather conditions are most unfavourable.
That uncertainty is itself a governance challenge. Roychowdhury’s warning that forecasting source emissions remains difficult indicates that authorities need to distinguish between the pollution measured in the atmosphere and the changing contribution of its sources. Without that distinction, enforcement can become reactive, focused on the most visible activity rather than on the combination of sources producing the highest exposure.
## An airshed problem with fragmented administration
Delhi’s winter air illustrates the limits of city-by-city pollution management. Farm fires occur outside the capital, while traffic, construction and local combustion are concentrated within the urban region. Waste fires and industrial emissions may be distributed across several NCR jurisdictions. Weather, meanwhile, ignores administrative boundaries.
The result is a coordination problem. A city authority may control some road, waste or local-emission measures, but it cannot independently regulate all the sources that influence its air. Regional action is therefore necessary, particularly during the forecast period when agricultural fires, festivals and adverse meteorological conditions coincide.
The available evidence does not specify the current enforcement measures, the performance of any particular government programme, or the precise institutional division of responsibility among NCR authorities. It does establish that monitoring must extend beyond the AQI headline. Real-time changes in emissions and action across Delhi and the NCR are central to understanding whether interventions are reducing the causes of pollution or merely responding to the final concentration after it has accumulated.
This also changes the way residents experience official pollution communication. An AQI number tells people how polluted the air is at a given time, but it does not by itself explain whether the immediate driver is regional smoke, local traffic, firecrackers, industrial combustion or weather. That distinction matters for public response and for accountability, particularly when severe conditions persist over consecutive days.
## The recurring calendar of exposure
The sequence identified in the data has a clear calendar. Pollution begins to intensify as winter sets in during the second half of October. The first half of November is typically the worst period, followed by another severe phase from December 16-31 and a further high-risk period in the first half of January.
Festivals, weddings, Christmas and New Year’s Eve add to traffic and firecracker activity at different points in this calendar. Agricultural fires can increase around the beginning of November, while colder temperatures and fog become more important later. These overlapping factors mean that the city’s clean-air challenge cannot be reduced to a single seasonal trigger.
Last year’s relatively better performance during November 1-15, attributed in the report to an early Diwali and the low impact of stubble burning, reinforces the importance of timing and source interaction. A less severe period does not remove the underlying vulnerability; it shows that changes in the timing or intensity of emissions can alter the outcome when meteorological conditions are similar.
The evidence therefore supports a more precise understanding of Delhi’s pollution season. It is a recurring period of heightened risk, but not a fixed outcome. The annual AQI depends on how multiple sources behave and how atmospheric conditions evolve during each part of the winter.
## What the evidence confirms
The immediate fact is clear: Delhi has entered the fortnight that has historically recorded its highest average AQI, and the period coincides with several known emission pressures. The longer-term evidence shows that severe pollution episodes recur across November, December and January, with the first half of November carrying the highest historical average in the data cited.
What remains less certain is the exact source mix for the current episode and how effectively authorities are controlling emissions across the NCR. That gap is not a reason to treat the sources as interchangeable. It is a reason to improve real-time source tracking and link it to action across jurisdictions. The next developments to monitor are the AQI trajectory during November 1-15, the reported scale of farm fires and festive emissions, and the response of authorities across Delhi and the NCR as winter conditions intensify.