


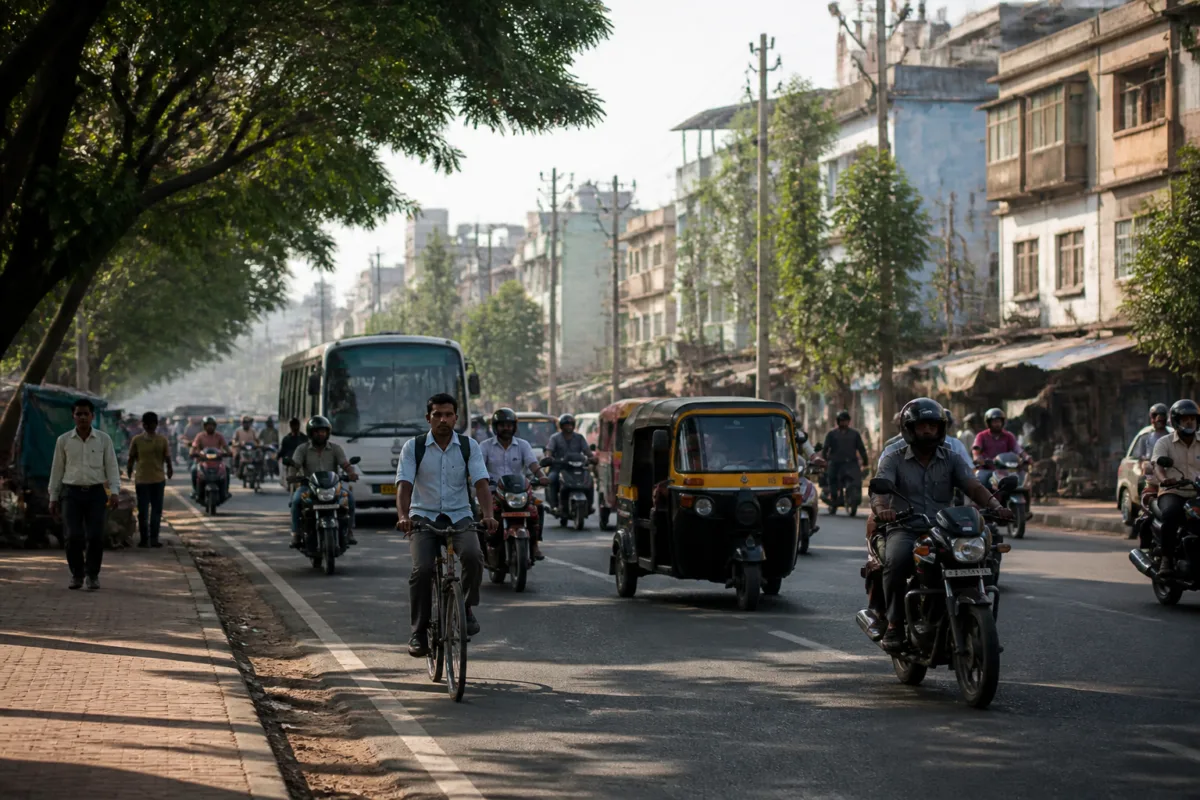
Odisha’s commuting costs are among the clearest indicators that the state’s urban system works differently from the large metropolitan model. Workers in the state spend an average of Rs 589 a month on travel to fixed workplaces if they are men and Rs 409 if they are women, compared with a national average of Rs 785, according to the National Household Travel Survey. The figures point to shorter journeys and lower daily mobility costs, but they also raise a more important question: are Odisha’s workers travelling less because cities are better connected, or because employment remains distributed across smaller settlements and rural areas?
The survey, conducted from July 2025 to June 2026 and released by the National Statistics Office earlier this month, covered 4.92 lakh households and more than 20.34 lakh people across 14,274 villages and 10,377 urban blocks. It counted journeys of more than 1 km, making the findings relevant to how workers and students move beyond their immediate neighbourhoods.
Odisha’s travel-time figures are also relatively low. Workers in rural areas took an average of 23 minutes to reach fixed workplaces, while urban workers took 22 minutes. Students took an average of 22 minutes to reach educational institutions. The one-minute difference between rural and urban workplace journeys is particularly significant because it does not fit the usual assumption that urban residents necessarily have shorter or easier commutes than rural workers. Instead, it suggests that the boundaries between rural and urban mobility in the state may be less sharply defined than in highly metropolitanised regions.
The national survey offers a broader reference point. Across India, 83.4% of workers reached fixed workplaces in less than 30 minutes. Two-wheelers were the most widely used mode, accounting for 42.6% of workplace journeys, followed by walking at 28.3%. Buses accounted for 6.7% and cars for 3%. Among students travelling more than 1 km, walking was the most common mode nationally, followed by buses and bicycles.
These figures establish the scale of everyday mobility, but they do not by themselves explain why Odisha records lower commuting expenditure. The survey data does not show whether the difference is driven by shorter distances, lower fares, greater use of walking or bicycles, lower vehicle ownership costs, different work patterns or a combination of these factors. The gap between men’s and women’s expenditure also requires caution. Women’s average monthly spending in Odisha was about 31% lower than men’s, but the available figures do not establish whether women travel shorter distances, use different modes or are more likely to work closer to home.
### Odisha commuting costs and the geography of work
One explanation lies in where jobs are located. Odisha’s workforce is not concentrated in large urban centres alone. The Sixth State Finance Commission report found that around 80% of the state’s manufacturing jobs were located in rural areas in 2023-24, compared with 53% nationally. This distribution could reduce the need for some workers to travel long distances into cities, particularly if employment is located near smaller settlements or rural production areas.
However, the employment figures do not prove that rural job concentration is the direct cause of lower commuting costs. They provide an important context for reading the survey, not a complete causal explanation. A worker may live close to a rural manufacturing unit, travel by a low-cost mode to a nearby town, or combine several short journeys. The survey summary does not provide enough detail to distinguish between these patterns.
The relationship between employment and settlement structure is central to understanding mobility in Odisha. In a metropolitan region, housing, employment and education are often separated over long distances. Workers may live on the urban fringe while jobs remain concentrated in central business districts, industrial estates or distant corridors. That spatial separation creates dependence on motorised transport and increases the time and money required to reach work.
The evidence described for Odisha suggests a different pattern in at least part of the state. Urban planner Piyush Rout attributed the lower costs partly to shorter travel distances and the use of bicycles, shared autorickshaws and public transport. He also said that many workers in cities such as Bhubaneswar live close to their workplaces. This does not mean every resident experiences convenient mobility, but it indicates that proximity remains an important feature of the state’s urban structure.
### The role of compact cities
Bhubaneswar’s grid-based layout was identified by Rout as one factor that can make movement between places easier. A grid does not automatically guarantee affordable or efficient transport, but a more legible street structure can shorten routes and make walking, cycling, shared transport and two-wheeler travel more practical. The survey’s low average travel times provide a basis for examining whether these physical characteristics are translating into everyday mobility benefits.
The state’s smaller urban settlements may have a different spatial logic from larger metros. Rout said many have developed along one or two main roads, often extending from villages. Their relatively compact spread can keep daily journeys short. Such settlements may not offer the range of jobs and services found in major cities, but the smaller distance between homes, workplaces and institutions can reduce the need for long-distance commuting.
This distinction matters for urban planning. A city’s success cannot be measured only by the number of roads, vehicles or large transit projects it contains. The distance between daily destinations is itself an important part of transport performance. If people can reach work, school and services within a short journey, they may spend less on travel even when public transport networks are less extensive than those in metropolitan regions.
At the same time, low commuting expenditure should not automatically be treated as proof of superior mobility. A low cost may reflect short journeys, but it may also reflect limited access to employment, lower incomes, dependence on walking or inadequate transport choices. The supplied survey findings do not establish which of these conditions applies in each part of Odisha. The figures therefore need to be read alongside questions about job access, gender, transport reliability and the quality of walking and cycling routes.
### What the gender gap does—and does not—show
The difference between men’s and women’s commuting expenditure is one of the survey’s most notable findings for Odisha. Men spent an average of Rs 589 a month, while women spent Rs 409. The lower expenditure among women could be associated with shorter or less frequent journeys, different transport modes or different workplace locations. It could also reflect work patterns that are not captured by expenditure alone.
That limitation is important because transport statistics can conceal unequal access. Two people may spend similar amounts or travel for similar durations while having very different levels of choice and safety. The figures supplied in the survey summary do not include enough information to assess those dimensions. They show a monetary difference, but not the reasons behind it or whether lower spending represents an advantage for women.
A fuller assessment would require data on distance travelled, frequency of journeys, mode choice, trip chaining and the location of workplaces. It would also need to distinguish between workers who have access to multiple transport options and those whose travel is constrained by cost or availability. The current evidence establishes a pattern, not its explanation.
### A planning lesson beyond the headline
The survey’s central lesson is that commuting outcomes are shaped by more than transport infrastructure. They are also shaped by the geography of jobs, the size and form of settlements, housing location and the distance between everyday destinations. Odisha’s relatively low commuting costs and short travel times provide evidence of a less metropolitan pattern of urbanisation, in which rural employment and compact settlements continue to influence mobility.
This does not make the state’s transport challenges insignificant. As cities expand and employment becomes more concentrated, longer journeys could emerge. But the supplied evidence does not establish that such a shift is occurring, and it would be speculative to predict it. What can be said is that Odisha’s current mobility profile differs from the model in which workers routinely cross large metropolitan regions to reach employment.
The survey confirms that Odisha workers spend less on commuting than the national average and that average workplace travel times remain close across rural and urban areas. It also shows that the reasons for this pattern are not fully settled. Rural job distribution, compact urban form, workplace proximity and low-cost modes are plausible contributing factors identified in the supplied material, but none alone explains the result. The next analytical step for policymakers would be to connect expenditure and travel-time data with distance, mode, gender and employment-location information. Without that detail, Odisha’s low commuting costs are best understood as a strong signal of how the state’s settlements and jobs are arranged—not as a complete verdict on the quality of its transport system.