


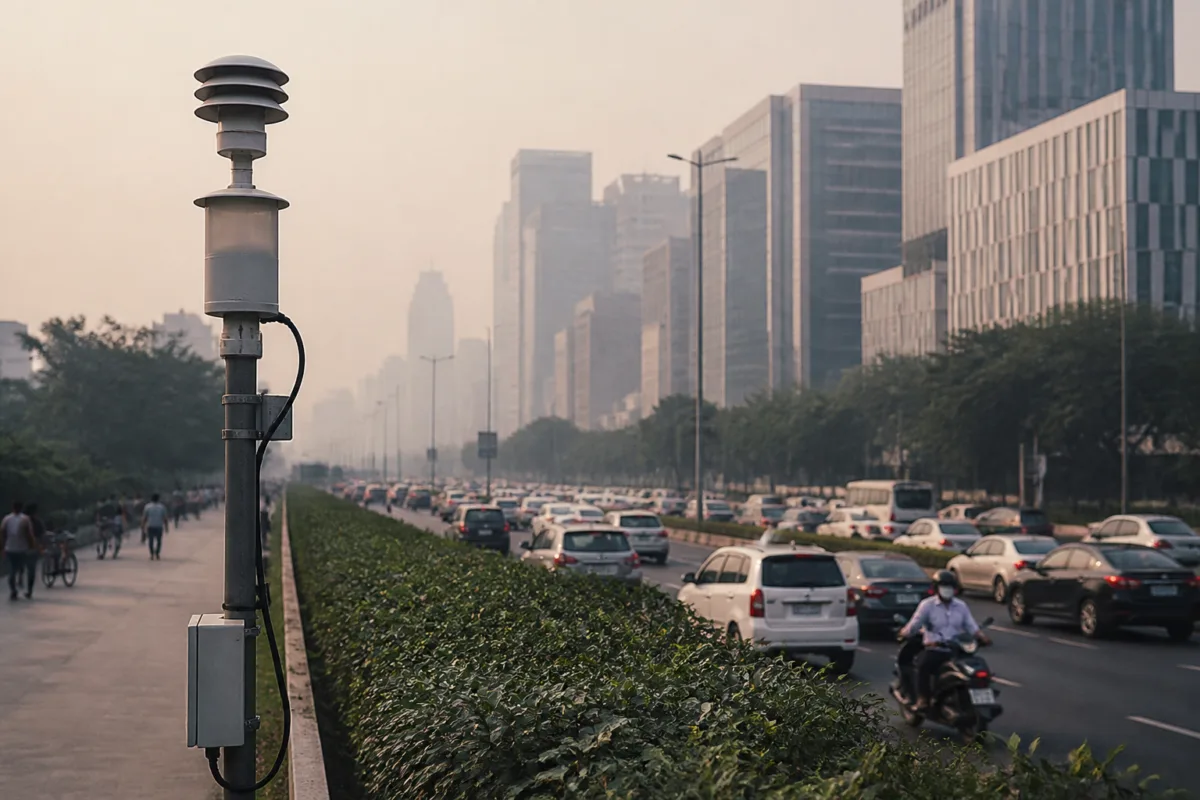
Mumbai’s air-quality picture looks substantially worse when readings from private sensors using the US AQI scale are placed alongside official measurements. The contrast is not merely a difference between cleaner and dirtier neighbourhoods; it is also a reminder that residents may receive sharply different accounts of the same urban atmosphere depending on which monitoring network and measurement scale they consult.
Official data put Mumbai’s average AQI at 124, categorised as moderate. Private sensors, however, recorded an average US AQI of 172, with readings fluctuating between 165 and 186 through the day. The figures come from different measurement systems, so they should not be treated as directly interchangeable. But the divergence is still significant because public understanding of pollution depends on how data is collected, processed and communicated.
The most important feature of the readings is their uneven distribution across the city. Official data identified BKC as Mumbai’s most polluted location, with an AQI of 169. It was followed by Andheri East at 162, Mazgaon and Worli at 161 each, Mankhurd at 151 and Colaba at 149. These figures indicate that pollution was not confined to one isolated pocket but appeared across commercial, residential and industrially influenced parts of the metropolitan area.
The private network showed even higher readings at some locations. Juhu’s JVPD Scheme recorded an average US AQI of 179, while Bandra Hill Road recorded 177, with readings ranging from 169 to 198. At the US Consulate in BKC, readings ranged from 184 to 229. The spread suggests that air quality can vary sharply over short distances, although the available report does not establish whether the differences resulted from local emissions, weather conditions, sensor placement, calibration or the use of separate AQI systems.
That limitation is central to interpreting the story. An AQI number is not only a description of pollution in the air; it is also the output of a monitoring and communication system. Official and private sensors may differ in location, equipment, sampling frequency and conversion method. The supplied report identifies the difference in readings but does not provide a technical comparison of the instruments or explain whether the private sensors were independently calibrated against official stations. It therefore establishes a measurement gap, not a definitive verdict that one network is correct and the other is wrong.
The official readings also reveal a city of highly differentiated exposure. Ghatkopar recorded the cleanest air in Mumbai, with an AQI of 38, categorised as good. Kandivli followed at 64, described as satisfactory, while Powai recorded 98. The distance between Ghatkopar’s reading and BKC’s official figure of 169 illustrates why a single citywide average can conceal the conditions experienced by people living, working or travelling in particular areas.
This matters for urban governance because citywide averages are useful for summarising conditions but weak at representing neighbourhood-level risk. A resident in Ghatkopar and a worker spending the day in BKC may technically share Mumbai’s average AQI, yet their local exposure could be very different. The location-level numbers in the report make that distinction visible, even though they do not explain the causes of each variation.
The wider metropolitan comparison adds another layer. Navi Mumbai recorded an average AQI of 118, described as moderate. Within the city, Mahape was the most polluted location at 141, followed by Nerul at 139. Taloja recorded the lowest reading at 102, followed by Sanpada at 104. Thane’s average AQI was 120, also in the moderate category. These figures place the three urban areas within a relatively narrow range on the reported official scale, while also showing meaningful variation between individual locations.
The contrast between the official and private readings raises an institutional question: which measurements should guide public warnings, local interventions and citizen behaviour when networks report different results? The source material does not identify a common data protocol between the networks, nor does it state whether authorities have responded to the private readings. Without that information, the policy significance of the discrepancy lies in the need for clarity about the basis of public air-quality communication.
Monitoring is particularly important in a region where administrative boundaries do not match the movement of people or pollutants. Mumbai, Navi Mumbai and Thane function as a connected metropolitan system for commuting, employment and industry, but the reported readings are presented separately. A city-by-city average can therefore describe conditions within each jurisdiction without showing how pollution patterns relate across the wider urban region. The available figures establish that the averages were 124 for Mumbai, 118 for Navi Mumbai and 120 for Thane, but they do not provide a regional explanation for those results.
The numbers also show why location, not just city identity, should remain central to air-quality reporting. Mumbai’s official readings ranged from 38 in Ghatkopar to 169 in BKC. Navi Mumbai’s listed locations ranged from 102 in Taloja to 141 in Mahape. Such variation means that a single label such as moderate can coexist with substantially different local readings. It also means that the usefulness of public information depends on whether it is available at a sufficiently local scale and whether residents understand which scale is being used.
The evidence currently confirms three things. First, official and private systems reported materially different averages for Mumbai. Second, pollution varied considerably between monitored locations. Third, the Mumbai metropolitan region did not have a uniform air-quality profile, with different readings recorded in Mumbai, Navi Mumbai and Thane. What remains unresolved is the technical reason for the gap between the networks and whether the readings can be compared directly after accounting for their different AQI scales and monitoring methods.
Those unresolved questions are not minor details. They determine whether the divergence represents a difference in measurement, a difference in local conditions, or both. Until the monitoring methods, calibration and conversion systems are explained, the safest conclusion is not that one figure replaces the other, but that Mumbai’s air-quality picture is more complex than a single official average suggests. Future reporting will need to track whether authorities publish comparable readings, clarify the relationship between public and private networks, and continue reporting neighbourhood-level conditions across the metropolitan region.