


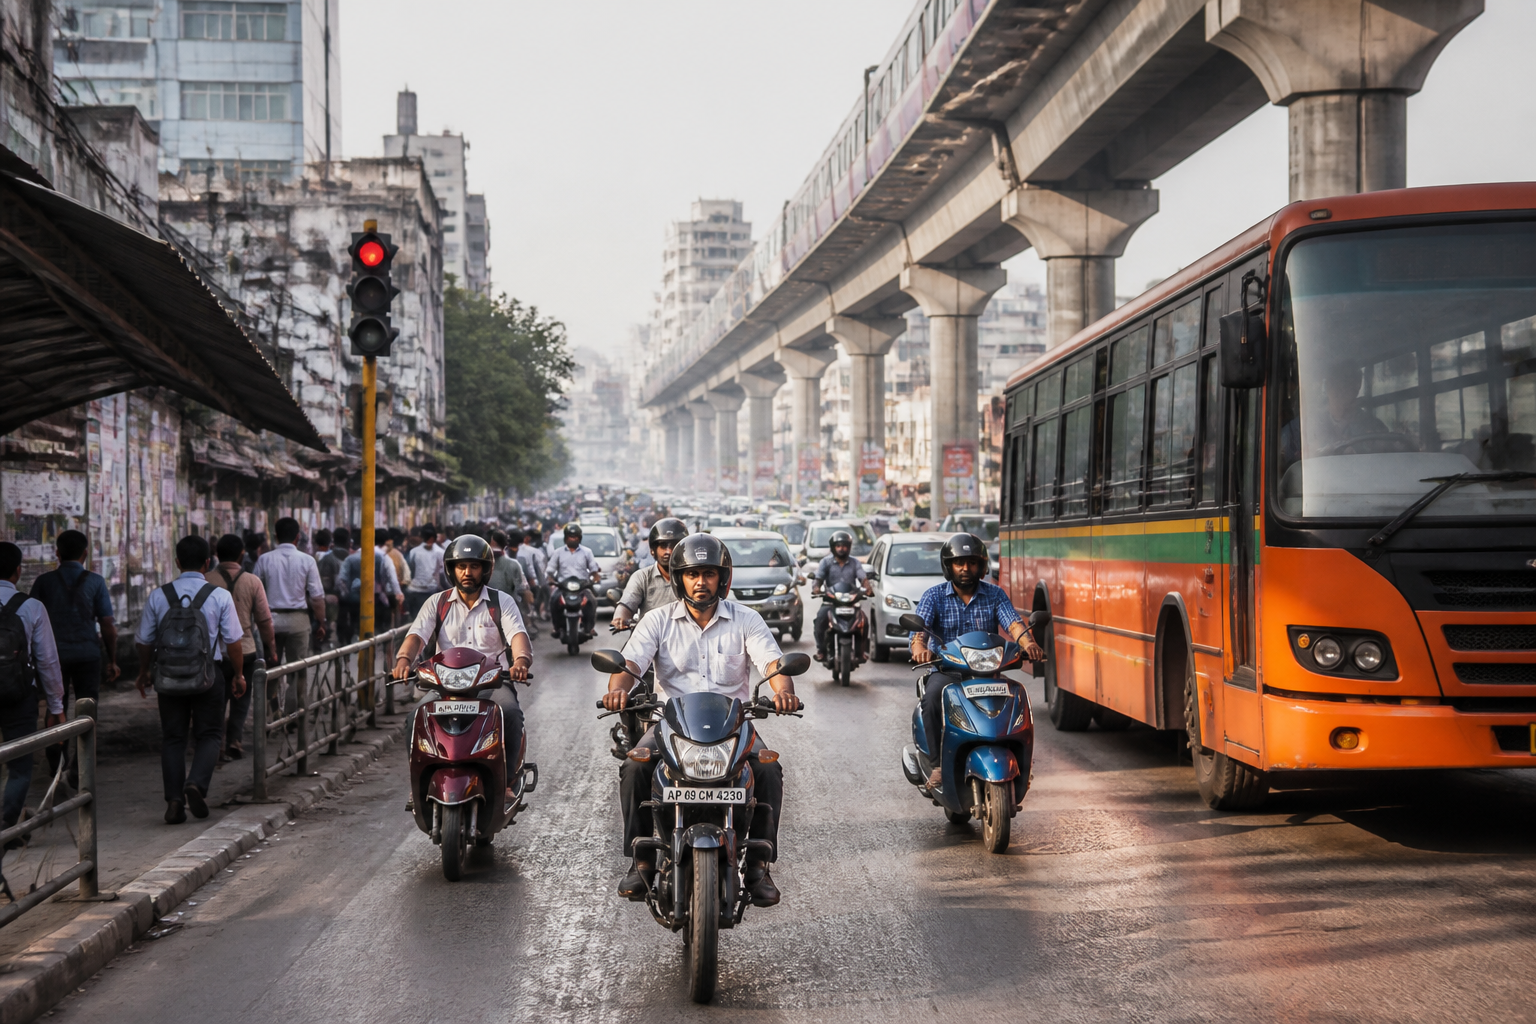
India’s first National Household Travel Survey shows that getting to work costs significantly more in cities than in rural areas, while urban workers also face longer average journeys and greater dependence on two-wheelers. The findings place everyday commuting, rather than only large transport projects, at the centre of the country’s urban mobility challenge.
The National Statistics Office, under the Ministry of Statistics and Programme Implementation, conducted the survey between July 2025 and June 2026. It recorded travel patterns, expenditure, journey times and transport modes for work, education and overnight household travel, covering trips of more than 1 km.
For workers travelling to a fixed workplace, the average monthly commuting cost was Rs 1,044 in urban areas, compared with Rs 612 in rural India. Across all workers, the average monthly cost was Rs 785. The difference is not only a measure of distance. It also reflects the way urban workers combine paid transport, vehicle ownership and daily access to employment in more dispersed city economies.
The survey recorded an average travel time of 27 minutes for urban workers travelling to fixed workplaces, against 23 minutes in rural areas. Nationally, the average was 25 minutes. Yet the time figures also show that a short average journey does not necessarily mean an efficient or equitable transport system. About 79.3 per cent of urban workers completed their journey within 30 minutes, while 13.7 per cent took between 30 and 60 minutes. The supplied findings do not provide a full breakdown of longer journeys, but they establish a clear urban-rural gap in both time and expenditure.
The reach of work travel is also uneven. About 57.6 per cent of workers travel more than 1 km to work. Within the travel day, 64.1 per cent of urban workers undertake trips to fixed or non-fixed workplaces, compared with 54.5 per cent of rural workers. These figures suggest that urban mobility is shaped by a larger share of workers moving through built-up areas for employment, although the survey data supplied does not establish whether those journeys are made within the same neighbourhood, across municipal boundaries or between cities and their suburbs.
The mode split presents one of the clearest signals in the survey. Two-wheelers account for 52.3 per cent of urban worker commutes, compared with 37.1 per cent in rural areas. Public rail-based transport, including metro, suburban rail, monorail and trams, accounts for 5 per cent of urban worker commutes nationally. In other words, the dominant urban commute is still motorised individual travel, even as cities expand rail networks and invest in mass transit.
The national rail figure conceals strong regional variation. Rail-based transport accounts for 20.7 per cent of urban worker commutes in Maharashtra, 16.5 per cent in West Bengal and 14.4 per cent in Delhi. These states contain some of India’s largest and most established urban rail systems, but the survey does not establish whether the higher shares result from network availability, route coverage, affordability, employment geography or a combination of these factors. What it does show is that mass transit use rises substantially where rail is a meaningful part of the urban transport system.
This distinction matters for how mobility infrastructure is assessed. A metro or suburban rail line is not used in isolation from the rest of the journey. The survey records the primary mode, but the supplied findings do not detail first- and last-mile connections, interchange costs or the share of commuters combining rail with buses, walking, autos or two-wheelers. The relatively low national rail share therefore cannot by itself measure the performance of individual systems. It does, however, show that the existence of rail-based infrastructure has not displaced two-wheelers as the main urban commuting mode across India.
The figures also reveal a gender dimension to access and mobility. About 61.9 per cent of male workers undertake daily work trips of more than 1 km, compared with 41.9 per cent of female workers. Among workers travelling to fixed workplaces, men spend an average of Rs 835 a month, while women spend Rs 533. The survey does not explain the causes of this gap. It does establish that men and women participate differently in daily work travel and that their reported commuting expenditure is not the same.
Those differences should be read alongside the survey’s coverage. The findings refer to workers and students undertaking specified travel, rather than providing a complete account of all urban residents who may be excluded from regular work travel, work from home, make informal or irregular trips, or face mobility constraints. The survey therefore provides a national baseline, but not a complete measure of transport disadvantage.
The education figures extend the mobility burden beyond the workplace. Students travelling to and from educational institutions spend an average of Rs 617 a month in urban areas, compared with Rs 361 in rural India. About 66.4 per cent of students commute more than 1 km daily. Nearly two-thirds of students aged six and above undertake within-travel-day trips of at least 1 km to attend their basic-course educational institution, with the share at 68.1 per cent in urban areas and 65.6 per cent in rural areas.
Student journeys are shorter on average than worker journeys, at 23 minutes nationally. Urban students record an average of 22 minutes, while rural students record 23 minutes. Nearly nine in 10 students complete their journeys within 30 minutes. Walking remains the most common mode among school students, accounting for about 37 per cent of journeys, followed by buses at 29.5 per cent and bicycles at 15.8 per cent. Auto-rickshaws account for 10.5 per cent overall and 14.4 per cent in urban areas, while two-wheelers account for 11.5 per cent of urban student commutes.
These figures show that urban mobility policy operates across several overlapping systems: worker transport, school travel, public transport, road space and household expenditure. A city may report a relatively short average commute while still placing a substantial monthly cost on households. It may also have rail infrastructure without making rail the primary option for most workers. The survey does not rank cities or evaluate individual projects, but it offers a common framework for asking those questions.
The institutional significance of the NHTS lies in that comparability. Before a nationwide household travel survey, transport discussions often relied on city-level studies, project reports or operational data produced by individual agencies. The NSO survey brings expenditure, time, mode and participation into the same national dataset. Its findings can support a more grounded understanding of whether urban mobility investments are reaching workers and students, although the supplied release does not state how the data will be incorporated into future transport planning or funding decisions.
The evidence points to a structural tension. Urban workers pay more to reach employment, yet most still rely on two-wheelers rather than rail-based public transport. Cities are therefore managing two linked pressures: the household cost of daily access and the infrastructure demands created by widespread private vehicle use. The survey does not provide fuel costs, parking expenditure, vehicle ownership data, emissions or congestion estimates, so it cannot quantify the full economic or environmental burden. It does show where the pressure begins: in the recurring cost and time required to make ordinary trips.
The regional variation in rail use also cautions against treating national averages as a single urban reality. Maharashtra, West Bengal and Delhi record much higher rail-based commute shares than the national urban average, while travel times vary across regions. Rajasthan, Gujarat and Madhya Pradesh record average worker travel times of around 20 to 23 minutes, while some southern parts of India report higher travel times. Northeastern states, including Assam and neighbouring states, record relatively lower travel times of around 15 to 19 minutes.
Those differences may reflect contrasting settlement patterns, employment locations, transport networks and urban forms, but the supplied survey findings do not identify the precise causes. What they provide is a starting point for separating transport problems that require new infrastructure from those connected to land use, job distribution, service frequency, affordability or last-mile access.
The larger urban question is not simply whether Indians spend Rs 785 a month on commuting. It is how much access to work and education depends on a household’s ability to absorb transport costs, own a two-wheeler or live near a viable public transport route. The urban-rural cost gap, the gender differences in work travel and the concentration of rail use in a few states all show that mobility is distributed unevenly.
The NHTS establishes the baseline: urban fixed-workplace commuters spend more and travel longer than their rural counterparts, two-wheelers dominate city commutes, and rail-based transport remains nationally limited despite higher use in selected states. What remains less clear from the published indicators is how costs and times vary within cities, between income groups and across different stages of a journey. Those are the next questions that city agencies and transport planners will need to answer as the survey becomes part of India’s urban evidence base.