


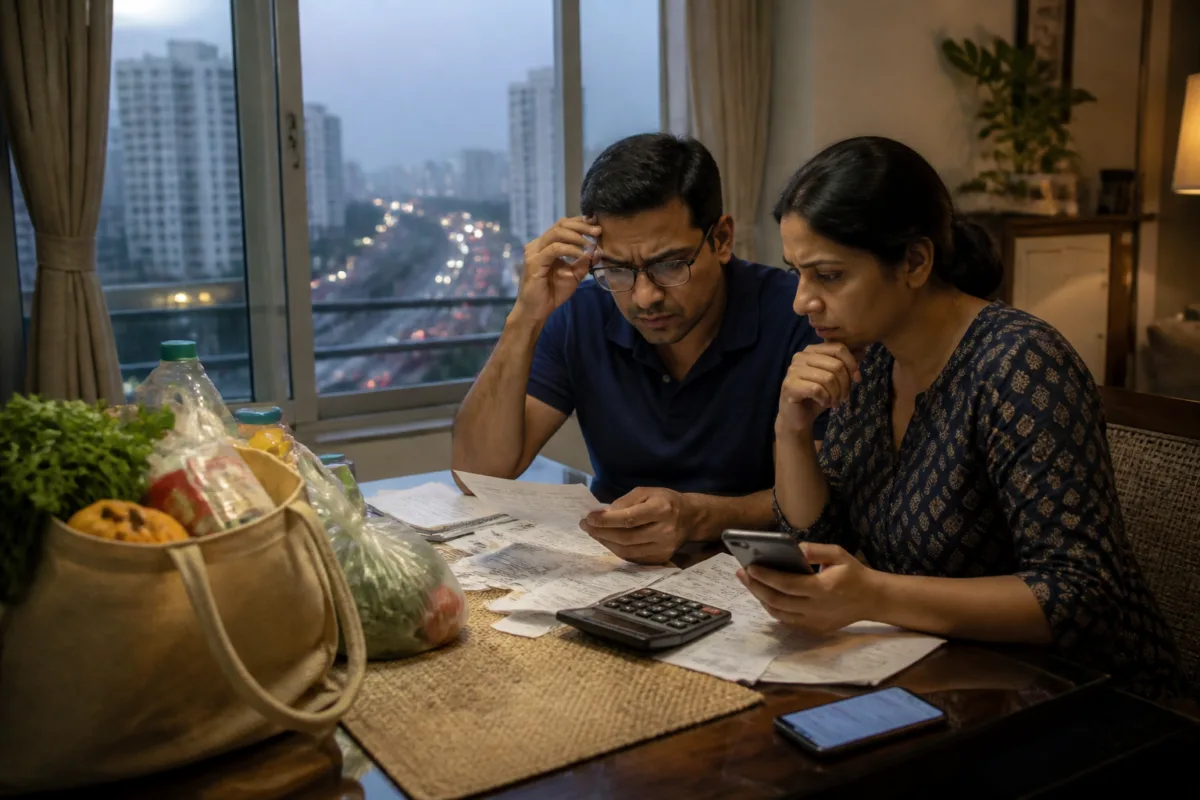
India’s salary hike inflation gap is becoming a household affordability problem rather than a workplace arithmetic problem. Companies are offering average annual increments of about 9%, but rising food prices, housing costs, transport expenses, loan repayments and insurance premiums are absorbing much of the increase before it can improve savings or discretionary spending.
That gap matters most in cities, where household budgets carry multiple fixed commitments. Rent or home-loan instalments, school and tuition fees, commuting costs, healthcare, utilities and consumer credit payments can leave families with little flexibility even when their gross income rises. The result is an important distinction between earning more and having more financial room.
The evidence in the latest figures cited by The Times of India points to a broad squeeze. The Reserve Bank of India’s September 2026 survey found that 90.1% of urban households were spending more on essentials than a year earlier. At the same time, 54.5% felt that the economic situation had worsened, compared with 40.9% in September 2025. These responses suggest that household experience is being shaped less by the headline salary number and more by the cost of maintaining everyday urban life.
Average salary increments remain positive on paper. Aon’s salary survey put the average increase at 9% in 2026 and projected 9.1% for 2027. Deloitte’s survey of India Inc. also projected an average increment of around 9.1%. But an annual increment is not the same as an equivalent rise in purchasing power. Taxes, deductions, inflation and individual spending patterns determine how much of the increase reaches the household budget.
The source report estimates that a 9% salary increase, compared with retail inflation above 5%, represents a real gain of roughly 3.3% using a simple comparison. That calculation is only illustrative, because household inflation differs according to the items a family buys. A household that spends heavily on food, rent, school fees, transport or medical care may experience a much smaller improvement than the headline figures suggest.
Government labour data also shows that income growth is uneven across employment categories. According to the Ministry of Statistics and Programme Implementation’s Periodic Labour Force Survey for 2025, average monthly earnings for regular salaried men rose 5.8%, from Rs 22,891 to Rs 24,217. For regular salaried women, the increase was 7.2%, from Rs 17,126 to Rs 18,353. Self-employed men recorded an increase of about 6%.
The position of casual workers was markedly weaker. Average daily wages for male casual labourers remained almost unchanged at Rs 455, compared with Rs 456 earlier. This uneven income pattern is significant for cities because urban economies combine formal salaried employment with self-employment, casual work, platform-linked livelihoods and small businesses. A salary-hike narrative therefore covers only one part of the labour market.
Food prices are central to the squeeze because groceries cannot easily be postponed. Retail inflation reached 5.54% in September, while food inflation rose to 7.74% from 5.97% in August. The report cited year-on-year increases of 108% for onions, 63% for ginger and 55% for garlic. Rural inflation was higher at 6.08%, compared with 4.88% in urban areas, but urban households remain exposed to food costs through both household purchases and the prices of prepared food and services.
The pressure becomes clearer when household spending patterns are examined. The Household Consumption Expenditure Survey for 2023-24 found that food accounted for 39.68% of spending in urban India and 47.04% in rural India. Average monthly per capita consumption expenditure stood at Rs 6,996 in urban India and Rs 4,122 in rural India. A rise in food prices therefore affects households differently depending on income, family size and the share of the budget devoted to essentials.
The revised Consumer Price Index has reduced the weight assigned to food and beverages from 45.86% to 36.75%, reflecting changing consumption patterns. That change can make the headline inflation number less sensitive to food-price movements than the earlier index was. It does not, however, alter the bill paid by a family whose monthly budget is concentrated on groceries.
Other categories also show why household experiences diverge. September inflation was reported at 2.74% for housing and fuel, 3.94% for education and 1.40% for healthcare. Food and beverages recorded category-wise inflation of 7.36%, while restaurants and accommodation rose 9.36%. These averages conceal different levels of exposure. A tenant paying rent, a homeowner servicing a mortgage and a family paying school fees will each face a different effective inflation rate.
For urban households, housing and transport costs are particularly important because they are often recurring and difficult to reduce quickly. A family may cut restaurant visits, postpone a holiday or delay replacing a phone, but cannot easily stop paying rent, commuting to work, servicing a home loan or buying food. The report quotes Jyoti Prakash Gadia, managing director of Resurgent India, saying that housing, healthcare, education, transport, EMIs and insurance premiums were claiming a larger share of household budgets.
The distinction between slowing inflation and falling prices adds another layer to the problem. When inflation declines, prices are still rising, only at a slower pace. Earlier increases remain embedded in household budgets. This is why a family may feel no relief even when the rate of price growth moderates. The financial impact depends on the accumulated level of prices and the speed at which income adjusts.
Consumer sentiment data reflects this difference between official measures and lived experience. RBI surveys recorded median perceived inflation of 8.4% in September, with households expecting it to reach 10% over the following year. That was higher than the official retail inflation rate of 5.54%. Urban households also recorded a fall in the current situation index from 96.9 in September 2025 to 87.9 in September 2026. A reading below 100 indicates that more households view conditions as worsening than improving.
Spending responses provide another signal. The net response among urban households on essential spending stood at 88.4, while the corresponding figure for non-essential purchases was 4.6. The contrast suggests that households continue to spend where they have limited choice but are becoming cautious about discretionary consumption. This has implications beyond family budgets. Urban retail, restaurants, leisure, travel and other consumer-facing sectors depend on the spending that households can make after fixed obligations are met.
Fuel prices can widen the pressure because they affect both direct household expenses and the cost of moving goods and people through cities. Petrol and diesel prices rose by Rs 3 per litre on May 15, according to the report, while Union oil minister Hardeep Singh Puri said state-run refiners were incurring losses of around Rs 10 billion a day while keeping retail prices low. Wholesale inflation reached 11.39% in September, with fuel and power prices up 25.85% and manufactured-goods inflation at 9.76%.
Wholesale inflation does not automatically translate into an equal rise in retail prices. Businesses may absorb some costs depending on margins, competition and demand. But the figures show why transport, manufacturing and distribution costs remain relevant to household affordability. RBI governor Sanjay Malhotra said inflation and its outlook were not as benign as they had been the previous year, while the central bank expected headline inflation to average nearly 5.8% over the next three quarters.
Household borrowing has become another channel through which the income-cost gap is managed. RBI data cited in the report shows household debt rising to 45.9% of GDP in March 2026 from 36.4% in June 2022. Household debt increased 78% during that period, while financial assets grew 49%. In 2025-26, households added Rs 42.9 lakh crore to financial assets and took on Rs 21.4 lakh crore in fresh loans. Net financial savings declined to 6.2% of GDP from 7% earlier.
The composition of debt is significant for household resilience. Non-housing retail loans, including personal loans, credit-card debt and gold loans, accounted for 58.4% of household debt, according to the RBI’s Financial Stability Report. Delinquencies in small-ticket loans rose to 6.4% in March 2026. For families already managing rent, food, commuting and education costs, borrowing can provide short-term liquidity while creating another fixed monthly obligation.
The report illustrates the effect through a home-loan calculation. Assuming full pass-through, a 0.25 percentage-point increase on a Rs 50 lakh loan with a 20-year tenure, initially priced at 8.5%, would raise the monthly EMI from approximately Rs 43,391 to Rs 44,186. The additional Rs 794 is modest in isolation, but becomes material when combined with higher grocery bills, transport costs, school fees and other commitments.
The larger urban question is whether income growth is translating into secure household capacity or merely preventing financial deterioration. The evidence does not establish that every family is worse off, nor does it show that salary increments have no value. It does show that the value of an increment depends on the structure of household expenditure, exposure to debt and the prices of essential goods and services.
For policymakers, businesses and urban households, the next indicators will be retail inflation data scheduled for November 12, wholesale inflation data due on November 16 and the RBI’s monetary policy meeting from December 2 to 4. Those releases will help show whether the gap between earnings growth and essential expenditure is widening or narrowing. Until then, the central measure of a salary hike is not its percentage on an appraisal letter, but the amount that remains after the urban household has paid for the life it cannot postpone.