


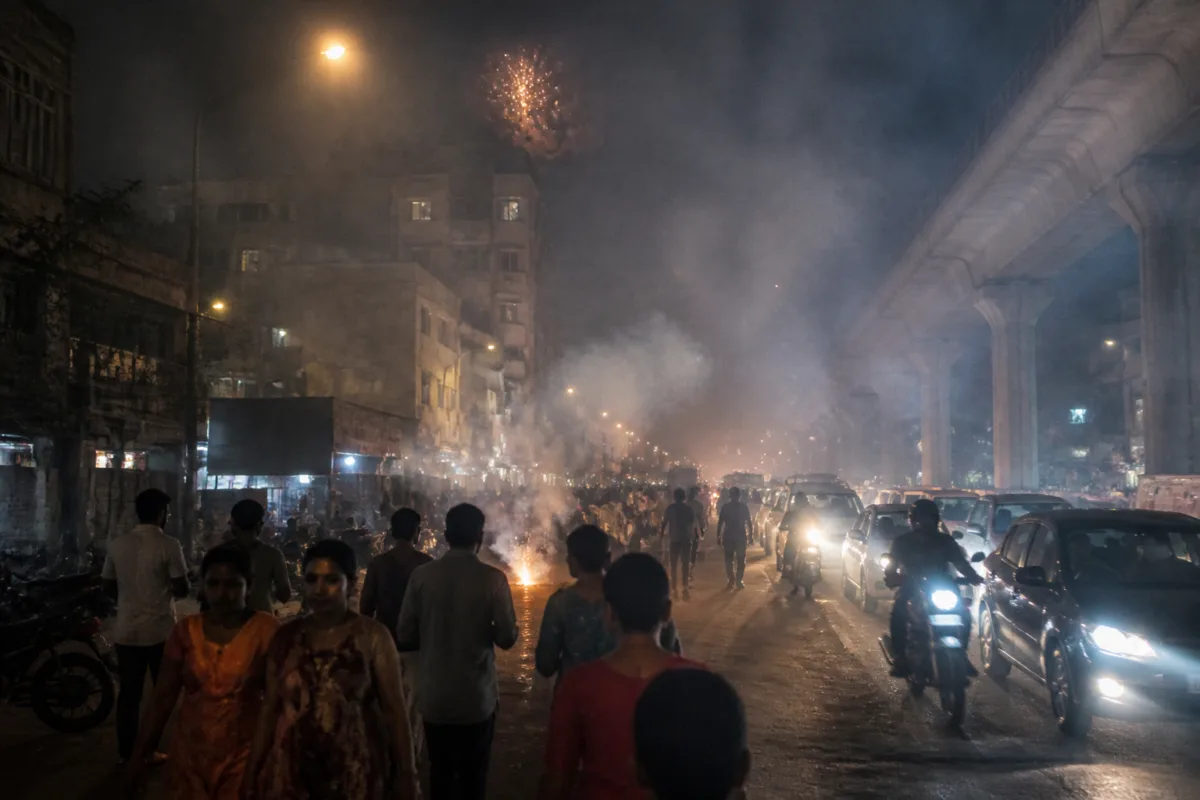
Pune’s Diwali air pollution spike was not merely a short-lived festival nuisance. Peak PM2.5 concentration reached around 1,000 µg/m³ at 2am on Monday, according to a report citing a Maharashtra Pollution Control Board comparison, while the city’s night-time noise readings also increased at seven monitored locations. The figures point to a difficult urban governance problem: rules may exist, monitoring may take place, but compliance and enforcement remain difficult during periods of concentrated, city-wide activity.
The comparison is stark. Pune’s peak PM2.5 level during this year’s Diwali was reported at approximately 1,000 µg/m³, against around 600 µg/m³ during the festival last year. The reported peak was also far above the Central Pollution Control Board’s National Ambient Air Quality Standard of 60 µg/m³ cited in the report. Because the measurement was a peak reading recorded at a particular time, it should not be treated as the city’s average air quality for the entire day. It does, however, show the intensity of pollution recorded during the most affected period.
The timing matters. The peak was recorded at 2am on Monday, after Diwali celebrations had continued into the night. That places the reading within the period when residents would ordinarily expect quieter neighbourhood conditions and reduced outdoor activity. Instead, the data captured a concentrated pollution episode at a time when exposure can affect people inside homes as well as those outdoors, although the supplied report does not provide individual exposure estimates or health-outcome data.
The air-quality figure is only one part of the reported deterioration. Night-time equivalent noise level, or Leq, rose at all seven monitored locations included in the Maharashtra Pollution Control Board comparison of Laxmi Pujan in 2025 and 2026. Laxmi Road recorded a 2.02% increase, followed by Sarasbaug at 1.49%, Shaniwarwada at 1.32%, Khadki Bazaar at 1.18% and Shivajinagar’s Sakhar Sankul at 0.27%. The report says readings increased across the seven monitored locations, although it identifies five of those locations by name.
Leq is an average noise level calculated over a specified period. It accounts for variations in sound during that period rather than relying on one isolated reading. That makes it useful for comparing overall night-time conditions between locations or years. It also has a limitation that is important in this case: Leq does not show how loud individual firecracker bursts were at their peak. A modest change in an average therefore does not necessarily mean residents experienced only modest individual noise events.
This distinction illustrates why urban environmental monitoring needs more than one number. PM2.5 concentration and Leq measure different forms of pollution, and both are shaped by time, location and the method used to record them. The reported PM2.5 figure is a peak concentration, while the noise figures are equivalent levels measured over a period. They should not be merged into a single measure of festival pollution. Taken together, however, they establish that the reported problem was both airborne and acoustic, and that it extended across multiple monitored urban locations.
The geographical spread is also significant. The locations named in the report include Laxmi Road, Sarasbaug, Shaniwarwada, Khadki Bazaar and Shivajinagar. These are not presented as one isolated residential pocket. The comparison instead covers different parts of Pune, including busy commercial and public areas. The supplied material does not provide the full monitoring network, the individual PM2.5 readings by location, or the precise duration of each measurement, so it cannot establish how evenly the pollution was distributed across the wider metropolitan area. It does show that higher night-time noise readings were recorded at multiple monitored sites.
That makes enforcement the central institutional question. The report says firecracker norms were blatantly violated across the city and that several residents and activists called for a complete ban, arguing that existing norms were not being implemented effectively. Their demand is a response to the gap between regulation and observed conditions. It is not evidence that a complete ban has been adopted, nor does the supplied material establish which agencies were responsible for individual violations or how many enforcement actions were taken.
The distinction matters for public administration. A rule can fail in at least two ways: it may be poorly designed, or it may be inadequately implemented. The reported figures and resident reactions primarily raise the second question. The report does not assess whether the applicable norms were clear, whether enforcement teams were adequately staffed, how complaints were handled, or whether penalties were imposed. Without those details, it is not possible to identify the precise administrative failure. What can be said is that the recorded pollution increase and reports of widespread violations indicate that the presence of norms alone did not prevent the reported outcome.
The Maharashtra Pollution Control Board’s comparison provides an important administrative function by placing the current festival against the previous year. The comparison shows that the reported peak PM2.5 concentration rose from approximately 600 µg/m³ last year to around 1,000 µg/m³ this year. The noise comparison similarly records increases at the monitored locations. Year-on-year comparisons can make deterioration visible, but they also need consistent measurement conditions to be interpreted fully. The supplied report does not specify whether the same instruments, monitoring durations, weather conditions and precise time windows were used for both years. Those details would be necessary to assess the comparability of the readings in greater depth.
The air-quality standard cited in the report provides another reference point. A peak PM2.5 concentration of around 1,000 µg/m³ is approximately 16.7 times the cited standard of 60 µg/m³, not 17 times when rounded to one decimal place. The source headline describes it as 17 times the norm. The comparison is useful for communicating the scale of the exceedance, but it should be understood as a comparison between a recorded peak and the stated standard, not as a description of Pune’s average daily air quality.
For residents, the immediate issue is exposure during a period when pollution sources are concentrated in time. The report describes thousands of residents experiencing a sharp spike in air and noise pollution, but it does not provide hospitalisation numbers, respiratory complaints, age-specific impacts or other health indicators. Any assessment of medical consequences would therefore require additional evidence. The available data supports a narrower conclusion: residents were exposed to substantially elevated measured pollution during the reported festival period, and the readings were higher than the previous year in the comparisons cited.
The broader urban lesson is that environmental compliance is not only a matter of setting limits. It also depends on the ability to monitor conditions at the relevant hours, cover different neighbourhoods, communicate rules, respond to violations and publish comparable data. The report confirms the monitoring and comparison elements, and it records public criticism of implementation. It does not reveal the full enforcement chain. That missing information is central to understanding whether Pune’s problem was a failure of deterrence, limited monitoring, weak response capacity or a combination of factors.
The episode also demonstrates why air and noise should be examined together during large urban celebrations. Air-quality monitoring identifies particulate pollution, while noise monitoring captures a different dimension of the same activity. The seven-site Leq comparison cannot establish the loudest individual bursts, and the PM2.5 peak cannot describe the entire city’s daily average. Yet the two datasets, read with their limitations, indicate a festival period in which pollution pressures intensified across more than one environmental measure.
What the evidence confirms is clear: Pune recorded a reported peak PM2.5 concentration of around 1,000 µg/m³ at 2am on Monday, higher than the approximately 600 µg/m³ reported during last year’s festival and far above the cited 60 µg/m³ standard. Night-time Leq readings also increased at seven monitored locations in the year-on-year comparison. What remains unresolved is how consistently the rules were enforced, how the readings varied across the city and what health effects followed. Those are the questions that should shape the next stage of official reporting and public scrutiny.