


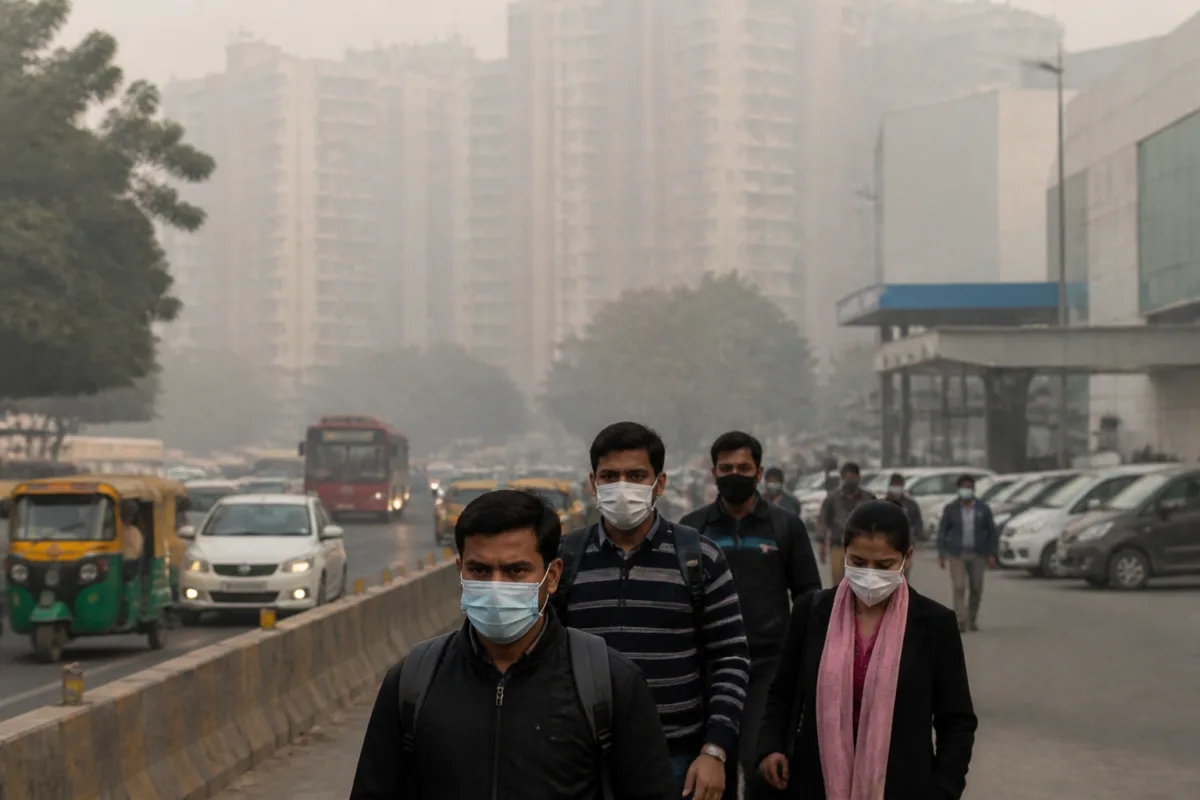
Pollution-linked health insurance claims have risen 4.3 times in three years, according to data shared by insurance marketplace Policybazaar and reported by PTI. The increase points to a changing urban risk profile in which poor air quality is no longer associated only with short-term respiratory discomfort, but is increasingly appearing in claims involving cardiovascular conditions, pneumonia and bronchitis.
The data places this shift at the intersection of three systems that are often discussed separately: urban air quality, public health and household financial protection. Cardiovascular and respiratory conditions together accounted for 78 per cent of pollution-associated health insurance claims. The report said the total payout rose 4.5 times to Rs 241.6 crore, while the average claim amount reached Rs 62,662.
These figures do not establish that pollution was the sole cause of each illness or claim. They represent pollution-linked claims identified in the data shared by Policybazaar. But the direction of the trend is significant for cities because it suggests that exposure to unhealthy air is increasingly being reflected in the way households seek medical treatment and insurance coverage.
## Pollution-linked health insurance claims are moving beyond a respiratory story
The composition of claims is central to understanding the change. Cardiovascular conditions accounted for 43.5 per cent of pollution-associated claims, followed by respiratory infections at 35 per cent, pneumonia at 11.2 per cent and bronchitis at 6 per cent. The figures show that respiratory illnesses remain a major component, but they do not represent the entire burden recorded in the report.
The prominence of cardiovascular conditions broadens the urban policy question. Air pollution is often addressed through measures such as emissions control, traffic management and restrictions on activities that generate visible particulate matter. The insurance data, as reported, indicates that the associated health-risk discussion now extends to more serious medical conditions and potentially higher treatment costs.
The report does not provide a clinical breakdown explaining how each claim was linked to pollution, nor does it specify the methodology used to identify pollution-associated cases. That limitation matters. Insurance claims data is not the same as a population-wide health survey, and the figures cannot by themselves measure the total number of pollution-related illnesses across cities. They do, however, offer a view of how pollution-related health events are appearing within the insured population.
## Working-age residents and older people account for most claims
The age profile is another important signal. Working professionals aged 31 to 55 accounted for 59 per cent of the claims, while senior citizens contributed another 31 per cent. Together, the two groups represented nearly 90 per cent of pollution-linked health insurance claims in the report.
Young adults aged 21 to 30 accounted for 6.7 per cent, while children below 20 made up 3.7 per cent. The distribution suggests that the recorded financial burden is concentrated among groups that may have greater exposure, higher healthcare utilisation, existing vulnerabilities or more access to health insurance. The supplied data does not identify which of these factors explains the age pattern.
For cities, the concentration among working professionals has an everyday mobility dimension. This group is likely to spend substantial time travelling through or working in urban environments, although the report does not provide information on occupation, commuting mode, location of exposure or duration of exposure. The available figures therefore reveal who is appearing in the claims data, but not precisely how their urban exposure occurred.
The senior-citizen share highlights a different concern. Older residents may already face greater health risks, and pollution can become an additional pressure on medical spending. Again, the report does not establish the medical history of claimants, but the 31 per cent share indicates that pollution-linked claims are not confined to the economically active population.
## Delhi leads, but the risk is not limited to major metros
Delhi recorded the highest number of claims at 8,093, followed by Pune, Bengaluru, Mumbai and Hyderabad. The ranking reflects the visibility of pollution-related health concerns in large urban centres, but the report’s wider geographic finding is more consequential: Tier-2 and Tier-3 cities together accounted for 55 per cent of claims.
That figure challenges the assumption that pollution-linked health risks are primarily a metropolitan problem. Large cities may have more extensive insurance penetration, greater availability of hospitals and more reporting channels, which can influence claim numbers. The report does not provide city-wise population denominators, insured-population figures or comparisons of insurance coverage. As a result, the figures should not be read as a direct ranking of pollution intensity.
Even with that qualification, the presence of a 55 per cent share from Tier-2 and Tier-3 cities indicates that the insurance and health implications of air pollution are distributed beyond the biggest metros. Smaller cities are expanding, attracting industry and experiencing growing traffic and construction activity, but the supplied report does not identify the specific pollution sources or urban conditions associated with their claims.
The institutional implication is that air-quality and health planning cannot be designed only around the most visible metropolitan hotspots. If pollution-linked claims are rising across a wider urban network, city administrations, healthcare providers and insurers may increasingly encounter similar pressures in places that receive less national attention.
## A pronounced seasonal pattern raises planning questions
Pollution-associated health insurance claims followed a seasonal pattern, with the highest numbers recorded between October and March. In FY26, nearly 56 per cent of annual pollution-linked claims were reported during these six months, a period that coincides with deteriorating air quality in several parts of the country, particularly during winter, according to the report.
The seasonal concentration has relevance for urban administration because it creates a recurring period of elevated risk rather than a one-off emergency. The data does not show whether claims rise immediately after pollution episodes, whether treatment is delayed, or how long the health effects persist. It does show that more than half of the annual claims in FY26 were recorded within a six-month window.
That pattern has implications for the timing of public-health communication, hospital preparedness and household insurance decisions. The report, however, does not provide evidence on hospital capacity, waiting periods, claim rejection rates or the proportion of pollution-related treatment paid out of pocket. Those gaps prevent a full assessment of how effectively the health system absorbs the seasonal burden.
For insurers, the reported pattern could affect health-risk assessment, product design, pricing and claims management. These are industry responses identified in the report, not confirmed policy changes. The data does not say whether premiums have already changed or whether insurers have introduced products specifically tied to pollution exposure.
## Higher coverage signals a financial response to urban pollution
The report said 48 per cent of consumers in highly polluted cities opted for higher health insurance coverage. This suggests that some consumers are recognising pollution as a potential financial risk in addition to an environmental or health concern.
The figure should be interpreted carefully. It describes consumers who chose higher coverage and does not establish whether their decision was caused solely by pollution, whether they had prior medical conditions or whether they were responding to broader healthcare costs. It nevertheless indicates that air quality may be influencing insurance behaviour among at least part of the urban population.
That matters because the financial consequences of pollution extend beyond the medical episode itself. The average claim amount of Rs 62,662 provides one measure of the cost recorded in the report. The 4.5-fold increase in total payouts, alongside the 4.3-fold rise in claims, indicates that the financial exposure has expanded substantially over the period covered, although the report does not specify whether the increase reflects more claimants, higher treatment costs, changes in coverage or a combination of these factors.
Without information on the number of policies, total insured persons, inflation, medical-cost increases and changes in data collection, the figures cannot be used to calculate a precise change in individual risk. They can still serve as an early warning that pollution is becoming visible in insurance markets as a recurring urban health cost.
## The bigger urban question is how risk gets measured
The most important finding is not simply that claims have increased. It is that the consequences of urban pollution are appearing across multiple layers of city life: in the health conditions reported by policyholders, in the concentration of claims during winter, in the higher payouts recorded by insurers and in consumer decisions about coverage.
The data also exposes what remains difficult to measure. It does not establish exposure pathways, distinguish indoor from outdoor exposure, compare insured and uninsured residents, or show how pollution-linked claims vary with local air-quality levels. It does not reveal whether the same pattern exists among people who cannot afford health insurance or who rely on public hospitals.
Those limitations are important because insurance data captures financial transactions, not the full urban health burden. Yet the pattern reported by Policybazaar provides a distinct institutional signal. Pollution is increasingly being treated not only as an environmental problem, but also as a health-risk and claims-management issue extending beyond respiratory disease and beyond India’s largest metropolitan areas.
The evidence confirms a sharp rise in pollution-linked claims, a major concentration among cardiovascular and respiratory conditions, a strong October-to-March seasonal pattern and substantial representation from Tier-2 and Tier-3 cities. The next questions concern methodology, population coverage and causation: how these claims were classified, how they compare with the uninsured population and whether the trend continues as urban air-quality risks remain persistent.