


India retail inflation rose to 5.54% in September 2026 from 4.83% in August, but the more important signal for cities is where the pressure is appearing: food, transport-linked costs, restaurants and accommodation, personal goods and imported inputs. The increase has pushed the Reserve Bank of India further towards caution just as households and businesses are absorbing higher prices across everyday urban consumption.
The September reading, based on government data reported by Economic Times, was the highest under the revised consumer price index series introduced earlier this year and the highest since October 2024, when inflation stood at 6.21%. Inflation has now remained above the Reserve Bank of India’s medium-term target of 4% for four consecutive months. The latest movement is therefore not only a food-price episode; it is also a test of how supply shocks move through the wider urban economy.
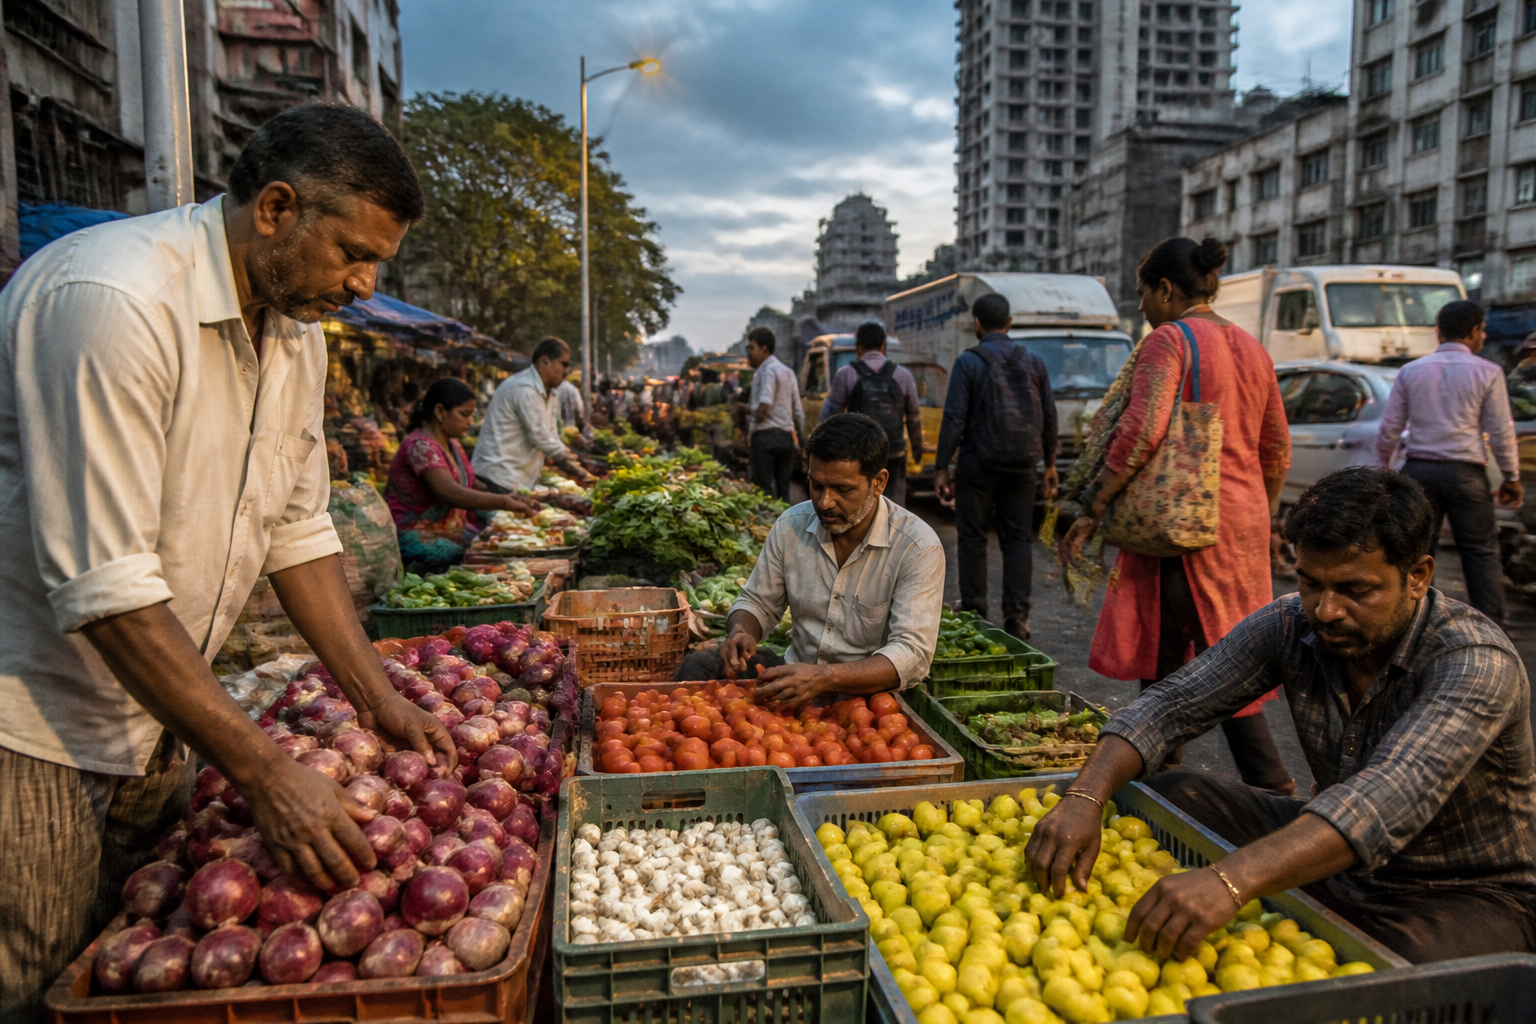
The immediate trigger was food. Retail food inflation accelerated to 7.74% in September from 5.97% in August. Rural food inflation reached 8.06%, while urban food inflation rose to 7.18% from 5.64% in the previous month. The distinction matters because food is a large component of household spending, and sharp changes in vegetables can quickly affect household budgets, restaurants, street vendors and food-service businesses.
Vegetable prices drove much of the increase. Onion inflation rose to 108.09% in September from 48.78% in August. Garlic inflation increased to 54.62% from 43.60%, while lemon inflation accelerated to 36.41% from 15.15%. Ginger inflation remained high at 62.85%, although it moderated from 73.82%. Tomato and potato prices were still below year-earlier levels, with inflation at minus 8.62% and minus 11.50%, respectively, but their declines narrowed in the case of tomatoes compared with August.
This uneven movement is important. A headline food number can conceal sharply different experiences across products and locations. A household that buys onions, garlic and other vegetables regularly may face a much higher increase in its weekly expenditure than the overall consumer price index suggests. In cities, the impact can extend beyond the home: restaurants and caterers may face higher input costs, while transport and storage expenses influence the price at which food reaches urban markets.
The September data records inflation of 9.36% in restaurants and accommodation services. Transport services for goods recorded inflation of 14.73%, providing another indication of how cost pressures are distributed through the urban economy. These figures do not establish that every restaurant or logistics operator has raised prices by the same amount, but they show that services and movement of goods are part of the current inflation picture rather than separate from it.
Transport inflation stood at 5.01%, while clothing and footwear inflation was 3.93%. Housing, water, electricity, gas and other fuels recorded inflation of 2.74%. Health inflation remained relatively subdued at 1.40%, and education services inflation stood at 3.94%. The pattern is therefore mixed: some essential service categories are rising more slowly than food, while food, transport-related services and selected personal goods are exerting stronger pressure.
Silver jewellery inflation was 87.80% in September, down from 106.81% in August but still elevated. The broader category of personal care, social protection and miscellaneous goods and services recorded inflation of 13.75%, while other personal effects recorded inflation of 38.69%. These categories do not affect every household equally, but their performance contributes to the broader measure and shows how price changes have extended beyond the most visible vegetable shock.
The rural-urban gap is another significant feature. Overall rural inflation rose to 6.08% from 5.24%, while urban inflation increased to 4.88% from 4.31%. Rural food inflation was also higher than urban food inflation. For cities, this does not mean households are insulated from the shock. Urban consumers may pay more for prepared food, accommodation, delivery and other services in which agricultural and transport costs are embedded, even when the urban headline rate is lower than the rural rate.
The revised CPI series adds an important institutional layer to the data. The government changed the base year from 2012 to 2024 and updated the consumption basket to reflect changing household spending patterns. Comparisons with the earlier series must therefore be read with care. The September figure is still comparable within the revised series, but the change in methodology means that the composition of measured consumption has been updated at a time when urban households are also changing how they spend on services, mobility, housing and goods.
The policy response has already moved beyond monitoring. On October 7, the RBI’s Monetary Policy Committee raised the benchmark repo rate by 25 basis points to 5.50%, its first rate increase in nearly four years, and shifted its stance to calibrated tightening. The central bank had reduced the repo rate by a cumulative 125 basis points in 2025 and kept it at 5.25% for four consecutive reviews before reversing course.
The RBI also raised its inflation forecast for financial year 2026-27 to 5.2% from 5.0%. Its projections put inflation at 4.9% in the second quarter, 6.0% in the December quarter and 5.7% in the March quarter, followed by 5.6% in the first quarter of financial year 2027-28. The central bank cited higher crude oil prices, a deficient monsoon, El Niño conditions and the possibility that supply pressures could spread across the economy.
For the built environment, the significance of the repo-rate decision lies in the connection between macroeconomic policy and urban costs. A higher policy rate can affect the cost of borrowing for households, developers, businesses and infrastructure-related activity, although the supplied data does not establish the size or timing of any pass-through. At the same time, higher food, transport and service prices can reduce the room households have for rent, home purchases, repairs, education and other recurring expenses. The effects are transmitted through budgets rather than through one single price category.
Energy and currency risks add another layer. The source report says Brent crude oil has risen above $100 a barrel amid the escalation of the West Asia conflict, while the rupee has depreciated by around 7% against the US dollar. For an economy dependent on crude oil imports, these developments raise the risk of imported inflation through fuel, transport and production costs. The exact impact on individual urban services will depend on how companies absorb or pass on those costs, but the channels are clearly identified in the inflation outlook.
The RBI said the weighted share of items recording inflation above 4% increased to around 37% in August. It also flagged elevated inflation expectations and signs that inflation was becoming more generalised, while observing that the pass-through of supply-side pressures into firms’ pricing behaviour remained limited. This distinction is central to the policy challenge: food shocks may begin with weather or supply conditions, but they become more persistent when they spread across services and business pricing.
The government data and the RBI’s response together show an inflation episode with several overlapping components. Vegetables are the most visible pressure point, but transport services, restaurants, accommodation, personal goods, crude oil and the rupee are shaping the wider risk. Healthy foodgrain buffers and proactive government measures may help contain some weather-related effects, according to the central bank, but the September figures confirm that the inflation problem cannot be understood through the food basket alone.
What remains uncertain is how long the vegetable shock will last, whether higher crude prices will continue, and how broadly firms will pass higher costs to consumers. The next inflation readings, the RBI’s projected rise to 6.0% in the December quarter and the performance of urban food and service categories will determine whether September was a sharp interruption or part of a more persistent price cycle. For cities, the evidence already points to a central concern: inflation is being experienced not only at the market stall, but across the systems that move, house and serve urban households.

