


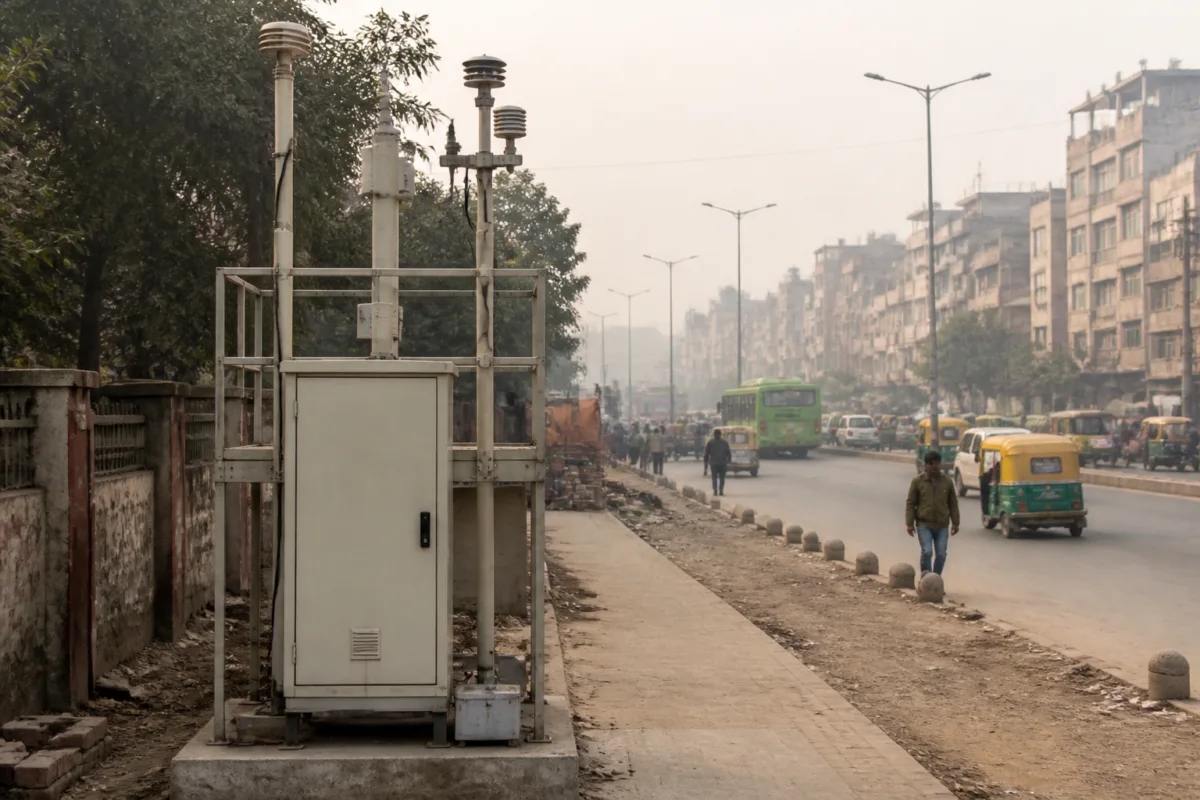
Jahangirpuri recorded Delhi’s highest average PM2.5 concentration so far this winter, highlighting how pollution continues to be concentrated in specific neighbourhoods even as citywide conditions vary significantly between monitoring locations.
An analysis of Central Pollution Control Board data from 59 active continuous ambient air quality monitoring stations found that Jahangirpuri recorded an average PM2.5 level of 161.1 micrograms per cubic metre between October 1 and November 16. The figure was 2.7 times the national daily ambient air quality standard of 60 micrograms per cubic metre and 10.7 times the World Health Organization’s daily guideline of 15 micrograms per cubic metre, according to the report.
Fifty-seven of the 59 stations recorded seasonal average PM2.5 levels above the national standard. The two stations below the standard were IGNOU in Maidan Garhi, at 29 micrograms per cubic metre, and the Cantonment area, at 33 micrograms per cubic metre. Both remained above the WHO guideline when assessed against that benchmark.
Punjabi Bagh recorded the second-highest average at 159.3 micrograms per cubic metre, followed by ITO at 157.7. Vivek Vihar in Lajpat Nagar and Delhi Technological University recorded averages of 149.8 and 148.6 micrograms per cubic metre respectively.
The distribution is significant for urban governance because the highest readings are not confined to one type of location. Among the five most polluted stations, Jahangirpuri, Punjabi Bagh and Vivek Vihar are among the 13 pollution hotspots identified in 2018 as areas where average pollution levels exceeded the city average. ITO and DTU were not part of that original group. Rohini and Bawana, two other locations in the current top 10, were also identified among the earlier hotspots.
The recurrence of several locations suggests that short-term emergency responses may not be sufficient for neighbourhoods facing repeated exposure. Manoj Kumar, an analyst at the Centre for Research on Energy and Clean Air, told The Times of India that Delhi’s pollution hotspots were becoming a recurring feature every winter. He called for year-round action across the city alongside targeted, location-specific interventions in persistent hotspots.
The monitoring data also shows why citywide averages can obscure local exposure. Anand Vihar, which ranked third last winter and was the most polluted station in 2024-25 with an average PM2.5 concentration of 207 micrograms per cubic metre, was ranked 46th in the current period, with an average of 94.4. Nehru Nagar, which ranked sixth last winter at 201 micrograms per cubic metre, was ranked 38th this season at 103.
These changes indicate that pollution patterns can shift between seasons and monitoring locations. They also reinforce the need to connect air-quality data with local decisions on traffic management, dust control, construction activity, waste burning and other potential sources, although the report does not attribute the recorded concentrations to specific causes at each station.
The current figures may not represent the full winter peak. The report cited experts who said that lower temperatures and dense fog had yet to set in, and that pollution levels could rise in December and the first half of January. For Delhi’s local administrations, the data points to a continuing challenge: emergency measures may need to be supplemented by sustained, hotspot-specific urban interventions and transparent monitoring of their results.