


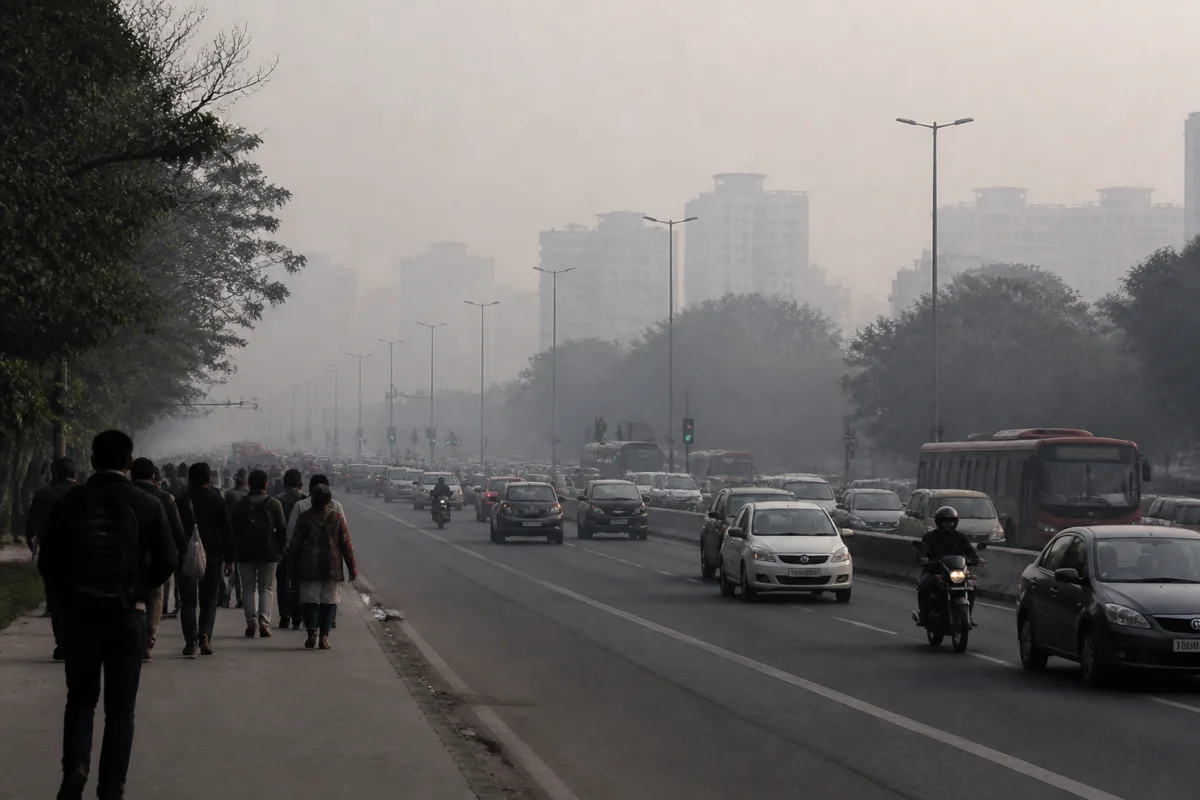
Delhi’s first November 1-15 without a single day of severe air quality since 2015 appears to mark a welcome improvement, but the city’s pollution data also exposes why a favourable headline cannot be treated as proof that the winter air crisis has been solved. The Central Pollution Control Board’s figures show that Delhi’s average AQI during the fortnight was 343, below 367 last year and the long-term average of 374 for this period. Yet missing particulate-matter readings on Diwali night, differences between older and newer monitoring stations and the city’s dependence on weather conditions complicate that result.
The headline is significant because November 1-15 is usually Delhi’s most polluted fortnight. CPCB began calculating the AQI in April 2015, and its data shows that the city recorded three severe days during this period in 2025, two in 2024, six in 2023, three in 2022, seven in 2021 and eight in 2020. The figure was six severe days in 2019, five in 2018, seven in 2017, nine in 2016 and three in 2015.
This year, Delhi recorded three poor days, with AQI between 201 and 300, and 12 very poor days, with AQI between 301 and 400. Its highest AQI was 382 on November 6. The city briefly entered the severe category on the morning of November 13, but favourable weather brought the 24-hour average down to 373, keeping the day outside the severe classification.
That distinction between hourly conditions and a 24-hour average is central to understanding the city’s air-quality reporting. An AQI above 400 is classified as severe on the scale that runs up to 500. A city can therefore experience dangerous pollution for part of a day without recording a severe day in the official daily average. For residents exposed to pollution during those hours, the difference between a daily classification of 373 and 400 does not necessarily represent a comparable difference in lived experience.
The Diwali data gap makes the interpretation more difficult. The CPCB did not share readings from several stations for many hours on Diwali night, when particulate-matter concentrations at several locations exceeded 1,000 micrograms per cubic metre. Those readings were not included in the 24-hour average AQI. An analysis by the Centre for Research on Energy and Clean Air, cited by The Times of India, found that Delhi’s average PM2.5 level could have risen from 269 to 400 micrograms per cubic metre if the missing readings had been recorded at 1,000 micrograms per cubic metre.
That calculation is not the same as an official revised AQI, and it does not establish what the city’s final daily classification should have been. It does, however, show how missing observations can affect a citywide average during a short but intense pollution episode. The result is that the absence of a severe day in the official series should be read alongside the limitations in the data used to produce it.
The monitoring network itself is another factor. Sunil Dahiya, founder of think tank Envirocatalyst, said the better result was linked to favourable weather, lower stubble-burning contributions and restrictions under the Graded Response Action Plan and Delhi’s winter framework. He also said that the larger monitoring network, including newer stations recording lower readings, had pulled down the city average. According to Dahiya, Delhi crossed into the severe category on three days when only long-running stations were considered.
Another expert cited in the report similarly said that many stations had recorded severe air quality during November, while newer stations with lower readings had affected the city average. These observations point to an institutional issue that is easy to miss in a single citywide number: the result depends not only on pollution levels but also on which stations are operating, how their readings are combined and whether extreme observations are available for the full averaging period.
This does not make the CPCB’s AQI meaningless. A standardised index is necessary for communicating air quality across a large city and for triggering administrative responses. But the November figures demonstrate why a citywide average should be read with station-level variation, hourly peaks and data completeness. A single number can simplify public communication while concealing sharp differences between neighbourhoods and time periods.
Delhi’s pollution is also shaped by more than one source. Indian Institute of Tropical Meteorology real-time source-apportionment data cited in the report showed that biomass burning, including stubble burning, domestic solid biofuel, dung cakes and wood, accounted for 30.9% of Delhi’s PM2.5 between 1 am and 9 am on the Monday covered by the report. Mixed combustion accounted for 27%, secondary organic aerosols for 19.6% and secondary inorganic aerosols for 8.8%. Vehicles contributed around 7.5% and firecrackers 5.8%.
These figures describe a particular time window rather than the complete pollution profile for the entire fortnight. They nevertheless illustrate the multi-source nature of Delhi’s air problem. The city’s air is affected by local combustion, transport, secondary pollutants and pollution transported from outside the urban area. This complicates any response that relies on a single intervention or treats one seasonal contributor as the sole cause.
Weather remains a decisive part of the system. The report notes that wind direction helped around Diwali and that less stubble smoke reached Delhi than in years with heavier burning. At the same time, the start of November was described as the most stagnant on record by Dahiya. These conditions pulled in different directions: stagnant air could trap pollution, while wind patterns and lower external smoke contributions could prevent concentrations from rising further.
The policy response is organised through the Graded Response Action Plan and Delhi’s winter framework, which impose restrictions as pollution worsens. The report attributes part of the improvement to these restrictions, but the supplied evidence does not quantify the contribution made by any individual measure. It also does not establish whether restrictions were implemented uniformly across the city or how their effect compared with meteorological conditions.
That limitation matters for governance. If favourable weather is responsible for much of the improvement, a lower November average may not be reproducible under more stagnant conditions. If restrictions made a measurable contribution, their design, enforcement and timing become important. The available material identifies both possibilities but does not isolate their respective effects.
The seasonal pattern offers a warning against treating the first fortnight of November as the end of the crisis. The second most polluted fortnight is typically December 16-31, with an average AQI of 346. That period combines low temperatures and dense fog, which trap pollutants, with increased traffic and firecracker use linked to weddings, Christmas and New Year’s Eve. Last year, it recorded five severe days, including a severe-plus day when the AQI reached 461.
The next difficult period is usually January 1-15. The report puts the average AQI for that fortnight at 329.3 between 2016 and 2026 and attributes the continuing risk to dense fog, low temperatures and calm winds. Delhi’s AQI was already 275, in the poor range, on the Monday cited in the report, while Sirifort recorded severe air quality at 441. The city’s air quality was forecast to worsen to very poor the following day.
The evidence therefore supports two conclusions at once. Delhi’s November 1-15 performance was better than in every year since CPCB’s AQI series began, when measured by the number of officially recorded severe days. But the result does not show that exposure was uniformly safe, that all severe episodes were captured in the daily average or that the seasonal pollution risk has passed.
The larger urban question is how Delhi measures and governs pollution in a city where exposure varies by location and hour, while public decisions often rely on a single daily average. The next milestones are the December and January pollution periods, the completeness of monitoring data during high-pollution episodes and whether the city’s restrictions continue to hold when weather conditions become less favourable.