


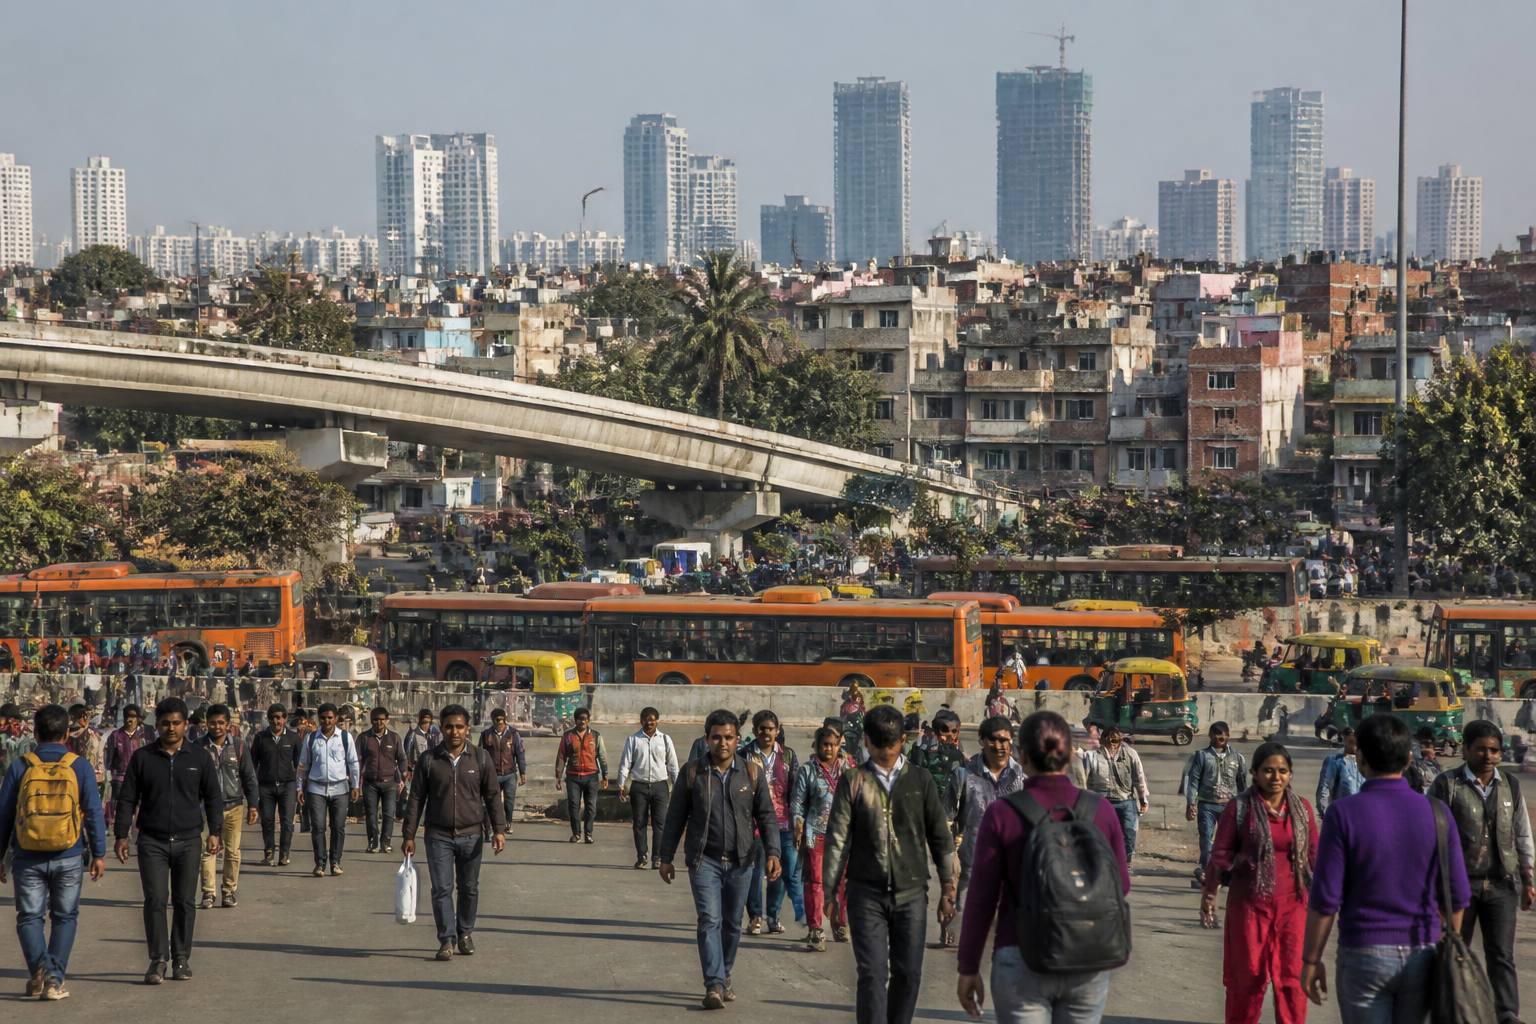
Delhi’s first district-level Periodic Labour Force Survey results show that unemployment in the capital is not evenly distributed. East Delhi recorded an unemployment rate of 8.3% and North West Delhi 7.4%, while South West, Central and South Delhi recorded rates of 3.2%, 3.5% and 3.8% respectively. The figures turn a citywide labour statistic into a map of sharply different economic experiences.
The results, released by the statistics ministry on Friday and derived from the annual PLFS 2025 data, offer the first district-level view of employment conditions in Delhi. They show that the capital’s labour market is shaped not only by the availability of jobs, but also by where people live, whether they participate in the labour force, their gender and their engagement with education or unpaid domestic work.
The spatial contrast is clearest in the unemployment figures. East Delhi’s 8.3% rate was the highest among the districts covered by the survey, followed by North West Delhi at 7.4%. At the other end were South West Delhi at 3.2%, Central Delhi at 3.5% and South Delhi at 3.8%. A combined unit comprising New Delhi, Shahdara and South East Delhi recorded the lowest rate at 2.4%.
These figures do not, by themselves, establish why one district has a higher unemployment rate than another. The report cited by The Times of India, however, connects the higher rates in East and North West Delhi with the influx of immigrants and population growth over the years. That association is important because it places employment pressure within the wider geography of a growing city, where the number of people seeking work and the capacity of local labour markets may differ considerably between districts.
The labour-force participation rate provides a second layer to the picture. LFPR measures the share of people aged above 15 who are either working or seeking work. East, North and North West Delhi recorded high LFPR alongside the higher unemployment rates. This combination indicates that more people in these districts are participating in the labour market, even though a larger share of them is unable to find work.
South Delhi presents a different pattern. It recorded the lowest LFPR at 41%, despite having a relatively low unemployment rate of 3.8%. A low unemployment rate can therefore coexist with lower participation. The figure alone does not describe the full condition of the labour market: it must be read alongside the number of people who are working or actively seeking employment.
The gender divide is more pronounced than the district-level unemployment gap. Female LFPR was below 20% in every Delhi district, compared with the national average of 30.7% cited in the report. North East Delhi recorded the lowest female LFPR at 9.8%, followed by North West Delhi at 10.7%.
The participation gap was not limited to districts commonly associated with lower incomes or fewer economic opportunities. Female LFPR stood at 13.9% in South Delhi, 12.5% in Central Delhi and 15.2% in South West Delhi. The figures indicate that women’s limited presence in the labour force is a citywide issue, although its intensity varies between districts.
That distinction matters for interpreting unemployment data. A district may record a lower unemployment rate partly because fewer people are participating in the labour force and actively seeking work. The Delhi results therefore point to two separate questions for policymakers: whether people who seek work can find it, and why so many women remain outside the measured labour force in the first place.
The survey’s NEET data adds another dimension. NEET refers to people who are not in employment, education or training. North Delhi recorded the highest overall NEET rate at 42.9%, followed by South Delhi at 36.1% and North West Delhi at 35.4%. The report links North and North West Delhi with higher education and coaching activity, but the data shows that a substantial share of residents in these districts were still outside employment, education or training.
The NEET measure is not limited to people who are idle or without an economic role. The report notes that people in this category may be engaged in unpaid domestic work or preparing for government examinations. That qualification is especially significant for understanding the gender dimension of the data. A person outside paid employment and formal education may still be performing essential household or care work that is not counted as participation in the formal labour market.
Female NEET rates were high across all districts. North Delhi recorded the highest female NEET rate at 73.2%, followed by Central Delhi at 71.3%. The report attributes this pattern to the unequal burden of care work and household responsibilities on women. The figures suggest that Delhi’s employment challenge cannot be assessed only through job creation or unemployment rates; it also involves the conditions that determine whether women can enter, remain in or return to paid work.
The district-level results also reveal the limits of a single citywide average. A capital-wide number can conceal the fact that one district has a high share of residents participating in the labour market but facing unemployment, while another has lower unemployment alongside lower participation. It can also hide differences in the number of people who are neither working nor studying and the much larger share of women in that category.
For urban administration, the data creates a more detailed basis for asking where employment-support systems are needed. The survey does not, in the material available, specify district-wise job programmes, transport access, childcare provision, skill initiatives or placement services. It therefore cannot establish which intervention would address the differences. It does show that a uniform citywide approach would not necessarily respond to the same problem in every district.
The institutional significance of the results lies in the fact that they provide a district-level measurement framework. The statistics ministry’s annual PLFS data can now be read against the geography of Delhi rather than only as a single estimate for the national capital. That allows future comparisons to examine whether the differences between districts persist, narrow or widen, provided subsequent data is reported on a comparable basis.
The results also make participation an important governance measure. Employment policy that focuses only on reducing the unemployment rate may miss people who are not seeking work, particularly women with household responsibilities. Similarly, a high LFPR may reflect strong engagement with the labour market but also greater exposure to unemployment when available jobs do not match the number of people seeking them.
Delhi’s labour map is therefore divided along several overlapping lines: district, participation, gender and engagement with education or training. East and North West Delhi combine relatively high unemployment with high LFPR. South Delhi combines a low unemployment rate with the city’s lowest overall LFPR. North and Central Delhi show particularly high NEET rates among women. Each pattern describes a different relationship between residents and the city’s economy.
The evidence does not establish a complete causal explanation for these differences, and the supplied results do not provide district-wise figures for income, occupation, commuting, household structure or access to services. What they do establish is that Delhi’s employment conditions are uneven and that women’s participation remains low across the capital. The next value of the district-level PLFS will lie in whether future rounds clarify how these patterns change and whether employment and participation improve together.