


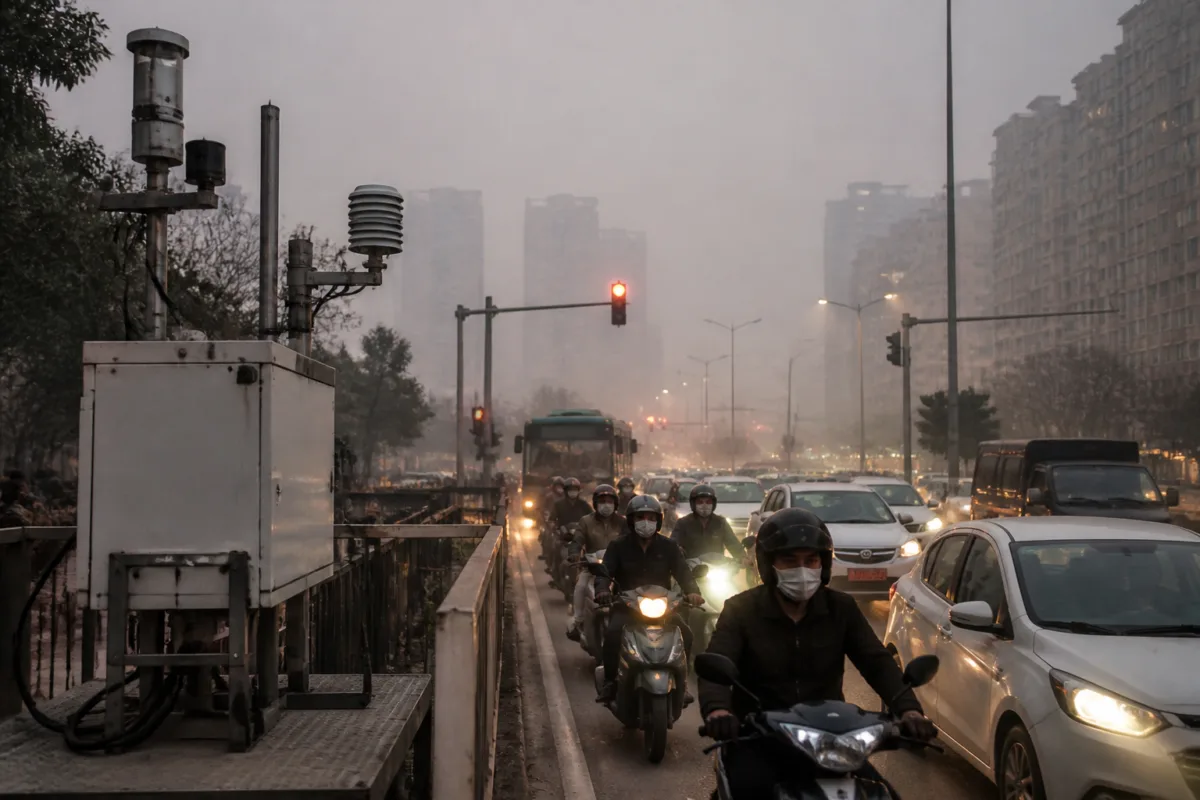
Delhi’s air-quality debate is no longer only about how polluted the air is. It is also about which measurement system residents are looking at. On the night of November 9, the Central Pollution Control Board’s official AQI for Delhi was 373, while another platform reported 1,747 for the city. The gap was not necessarily a contradiction in the underlying pollution readings. It reflected different pollutant breakpoints, averaging periods, data sources and upper limits used by the systems.
The discrepancy became especially visible on Diwali night, when screenshots circulated on social media showing Delhi AQI readings between 1,500 and 1,800. The CPCB’s National Air Quality Index, however, caps the Indian AQI scale at 500. At midnight on November 9, the CPCB reading was 373. The IAQIR platform, which uses a methodology based on the United States system, reported 214, while AQI Live-US reported 1,747. At 1 pm the same day, the CPCB reading was 360, IAQIR’s was 163 and AQI Live-US reported 217.
These numbers cannot be compared as if they were readings from one common scale. An AQI is a calculated index, not a direct measurement of pollution. Monitoring stations record concentrations of pollutants such as PM2.5, PM10, ground-level ozone, carbon monoxide, sulphur dioxide and nitrogen dioxide. Those concentrations are then converted into an index using breakpoint tables. The breakpoints determine which AQI value and category correspond to a particular pollutant concentration.
The same measured concentration can therefore produce different index values under different systems. The Indian scale uses categories ranging from Good to Severe, with the highest band extending from 400 to 500. The US scale uses categories including Good, Moderate, Unhealthy and Hazardous, with the upper range extending from 300 to 500. The CPCB has capped Delhi’s reported AQI at 500, while the other applications cited in the report do not apply the same ceiling.
The difference is also shaped by the period over which pollution is averaged. India’s system uses 24-hour averages for some pollutant calculations, while other systems may use shorter or longer averaging periods. For nitrogen dioxide, for example, the Indian methodology uses a 24-hour average and the US system uses a one-hour average. The report notes that a direct numerical ratio between the two is misleading because the averaging conventions are not the same.
Ozone adds another layer of difficulty. The US Good-category value of 0–54 parts per billion cited in the report comes from the Environmental Protection Agency’s official eight-hour table. A one-hour ozone table follows a different convention. At the severe or hazardous end, the differing averaging periods prevent a straightforward comparison. This means that even when two services refer to the same pollutant, their index outputs may not be directly interchangeable.
The breakpoint itself matters as much as the averaging period. A lower threshold means that an AQI category is reached at a lower pollutant concentration. The comparison in the report focuses on the Good and Severe or Hazardous categories of the six-category systems. The percentages are rounded, and the upper concentration limits used for the Good category are compared separately from the concentrations at which the Severe or Hazardous categories begin.
This is why a very high number on a private application does not automatically mean that the CPCB has undercounted pollution. It also does not mean that the higher number is meaningless. It indicates that the application is translating available pollutant data through a different scale and, in some cases, a different time window. The number’s meaning depends on the methodology that produced it.
The second major difference lies in the data infrastructure behind the applications. The CPCB collects raw readings from continuous ambient air-quality monitoring stations, or CAAQMS. Other platforms use a combination of government and non-government sources. According to the CPCB, some of these services also rely on private sensors and non-regulatory-grade instruments.
Low-cost sensors can expand the geographical coverage of air-quality information, but the CPCB has pointed to calibration and data-quality limitations. A private application may therefore be using a different set of instruments, alongside a different calculation method, from the official network. The resulting index can diverge even when both services are attempting to describe the same citywide pollution episode.
For residents, this creates a communication problem rather than merely a technical one. A person deciding whether to exercise outdoors, send a child to school or use protective equipment may see several numbers presented as AQI without an immediately visible explanation of the scale behind each number. The number that appears most alarming may not be the number recognised by Indian regulators, while the officially recognised number may not convey the full intensity of a short pollution spike if it is based on a longer average.
The CPCB’s position is that the AQI calculated under the National Air Quality Index is the official AQI for public dissemination in India. It says AQI data produced by other agencies are not recognised for regulatory or reporting purposes. At the same time, global air-quality platforms and private entities continue to disseminate data sourced from government and non-government instruments.
This distinction separates regulatory measurement from public information. The official AQI is the number used for formal communication and regulatory reporting under India’s system. Other services may offer supplementary information, including readings from locations or sensors outside the official monitoring network. But supplementary data cannot be treated as an equivalent regulatory index unless its methodology, calibration and averaging periods are comparable.
The Delhi episode also shows why a single citywide number can conceal important variation. The supplied report does not establish that every neighbourhood experienced the same pollutant concentration, nor does it provide a station-by-station comparison between CPCB monitors and private sensors. It establishes that the platforms used different methodologies and sources. The difference between the numbers should therefore be read as a measurement and interpretation gap, not as proof by itself that one platform’s reading is universally correct.
For urban governance, the central challenge is making these distinctions visible at the point where information reaches the public. An AQI dashboard or mobile application can display a precise number while leaving out the breakpoint table, averaging period, pollutant driving the index and status of the monitoring instrument. Without those details, precision can create confusion rather than clarity.
The evidence in the report confirms three things. First, the CPCB’s official Delhi reading was below 400 on the cited occasions and is capped at 500 under the Indian system. Second, other applications reported substantially different values because they used different breakpoints, averaging conventions and, in some cases, sensor networks. Third, the CPCB does not recognise those alternative outputs for regulatory or official reporting purposes.
What remains unresolved in the supplied material is how closely individual private-sensor readings matched nearby regulatory-grade CAAQMS stations during the Diwali episode. That comparison would be necessary to assess the accuracy of particular applications, rather than simply explaining why their AQI scales differ. Until such comparisons are available, Delhi residents should treat the number and the methodology behind it as inseparable parts of any air-quality report.