


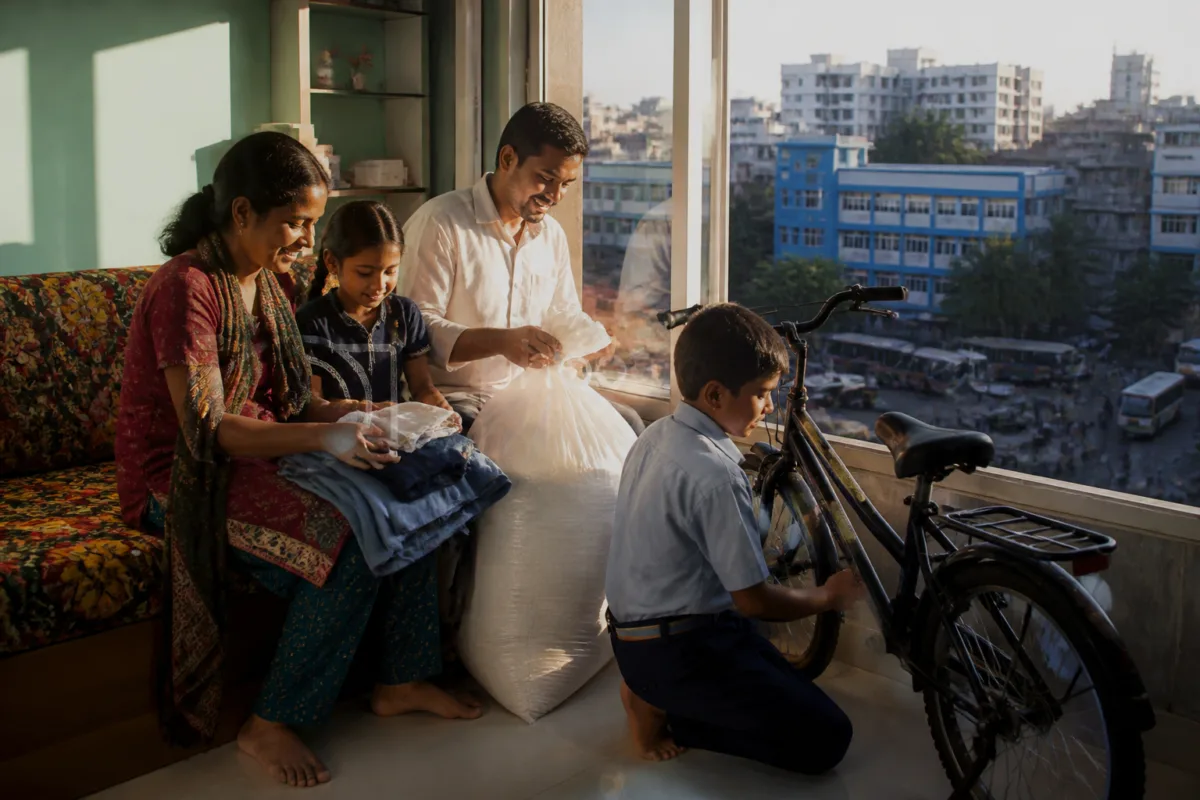
In-kind welfare is changing how living standards appear in India’s household data, with nearly 22 crore people moving into higher consumption brackets when free foodgrains, laptops, bicycles, school uniforms and other transfers are assigned a monetary value. The finding, reported from a study published in an NSO journal, suggests that consumption statistics can understate the practical purchasing power of households that receive public goods instead of cash.
Using unit-level data from the Household Consumption Expenditure Survey 2022–23, the study found that 15.8% of India’s population moved into a higher monthly per capita consumption expenditure category after the value of free goods was imputed. The impact was particularly visible among poorer households, where the avoidance of basic expenses can release cash for other needs.
The result is important for urban policy because household welfare is often assessed through what people purchase, not through the public services and goods they receive without payment. A family receiving subsidised or free foodgrains, education-related supplies or a bicycle may record lower market expenditure while experiencing a higher effective standard of living than its spending data alone suggests.
That distinction matters in cities, where household budgets are exposed to recurring costs for food, transport, education, healthcare, housing and utilities. The study reported that 8.4% of the urban population moved into higher consumption brackets after in-kind transfers were included. The corresponding figure for the rural population was 19%, underlining the wider reach of these benefits outside cities but also showing that urban households are not absent from the welfare effect.
The study also found that incorporating in-kind transfers reduced consumption inequality, as measured by the Gini coefficient. Its interpretation was that free goods and services can increase effective purchasing power by allowing households to retain money that would otherwise have been spent on items supplied through public programmes.
This does not mean that every welfare transfer has the same effect, or that consumption categories can be treated as a complete measure of living standards. It does, however, expose a measurement problem in urban governance: a household’s financial position cannot be understood solely through its cash income or reported purchases when the state directly supplies part of its consumption basket.
The regional pattern in the study was sharply uneven. West Bengal recorded the highest share of its total population moving into a higher consumption bracket after the value of in-kind transfers was included, at more than 40%. The transition affected 46.5% of the state’s rural population and 24.9% of its urban population. Chhattisgarh followed with 29.2%, Assam with 29%, Karnataka with 28.4% and Uttar Pradesh with 22.7%.
At the other end of the distribution, Gujarat recorded a transition rate of 3.7%, followed by Kerala at 4.6% and Haryana at 7.1%. The study associated the lower rates in industrialised and higher-baseline states with their existing consumption levels. In such states, fewer households may cross into a higher consumption category when the value of the transfers is added, even if the benefits remain useful to recipients.
The figures should therefore not be read as a simple ranking of welfare performance between states. A transition rate measures how many people move between consumption categories after an adjustment; it does not, by itself, establish the quality, reliability or adequacy of the services being delivered. Nor does it show whether households face other large expenses that could offset the value of a free good.
The study’s central contribution is to bring these non-cash benefits into the analysis of household welfare. The public distribution system’s free foodgrains are one example. Laptops, bicycles and school uniforms are others. Each transfer reduces the need for a household to purchase a particular item, but the impact on living standards depends on what the household would otherwise have spent and whether the supplied item meets its actual need.
For urban households, this distinction is closely linked to the idea of social infrastructure. Food distribution, school support and mobility-related goods may not appear in conventional discussions of urban infrastructure, which usually focus on roads, railways, water supply or housing. Yet these programmes shape how residents use the city and how much of their income remains available after essential costs are met.
A bicycle, for example, is not only a physical asset. Where it is usable and appropriate to local conditions, it can reduce the cost of reaching school or other destinations. A school uniform can remove a recurring education expense. Food support can reduce pressure on a household budget that is also exposed to rent, transport fares and utility payments. The study does not quantify these separate urban effects, but its method shows why they should not be ignored when evaluating living standards.
The findings also complicate the debate over welfare transfers that are sometimes criticised as populist measures, particularly when they are announced before elections. The study concluded that in-kind social welfare acted as a progressive measure because the largest upward movement was concentrated at the bottom of the consumption distribution. In its assessment, this indicated that benefits were reaching lower-income households.
That conclusion is narrower than a blanket endorsement of every transfer programme. It concerns the distributional effect observed in the data supplied by the study. Questions about programme design, fiscal sustainability, delivery quality and targeting are separate questions and are not resolved by the reported transition figures.
The administrative architecture behind these programmes also matters. The value of an in-kind benefit depends on whether eligible households can access it, whether supplies arrive regularly and whether the benefit is usable in the place where recipients live. A welfare programme may be recorded as an entitlement, but its effect on consumption depends on actual delivery and household uptake.
The study’s estimate is also conservative. Researchers noted that major public services, including free healthcare benefits under schemes such as Ayushman Bharat, or PM-JAY, and free school education were excluded because of limitations in the survey design. These exclusions mean the reported 22-crore figure does not represent the full possible effect of public provisioning on household living standards.
Healthcare and education are especially important to this calculation because they can create large out-of-pocket expenses. If households avoid or reduce such expenditure because services are provided through public schemes, their effective purchasing power may be higher than consumption data that captures only direct household spending indicates. The study said that including these savings would point to an even broader elevation of living standards across Indian households.
This limitation also sets a boundary for interpretation. The available evidence establishes that assigning monetary values to selected in-kind transfers changes the consumption classification of a substantial number of people. It does not establish the precise number of households that would move categories after all public services, differences in service quality and actual usage are included.
For city governments and policymakers, the broader lesson is that welfare and urban consumption are connected through household budgets. Public provisioning can influence the ability of families to pay for housing, transport, education and other urban necessities, even when the programme itself is not classified as an urban development intervention. A city’s affordability challenge is therefore shaped not only by wages and prices but also by which essential goods and services households receive outside the market.
The regional divergence raises another institutional question: whether states with different income levels and welfare systems should be assessed using the same consumption lens. A low transition rate in a higher-baseline state does not necessarily mean that public support is unimportant. Conversely, a high transition rate in a lower-baseline state does not by itself demonstrate that households have achieved secure or adequate living standards.
What the NSO study confirms is that the boundary between income support, public services and urban purchasing power is more porous than standard expenditure tables suggest. It also shows that the distributional effect of welfare cannot be understood fully without valuing goods supplied directly to households.
The next stage of this debate will depend on better measurement of excluded services, particularly healthcare and education, as well as clearer evidence on delivery and usage. Until then, the 22-crore estimate is best understood as a conservative measure of how in-kind welfare changed reported consumption positions, not as a complete account of India’s living standards.