


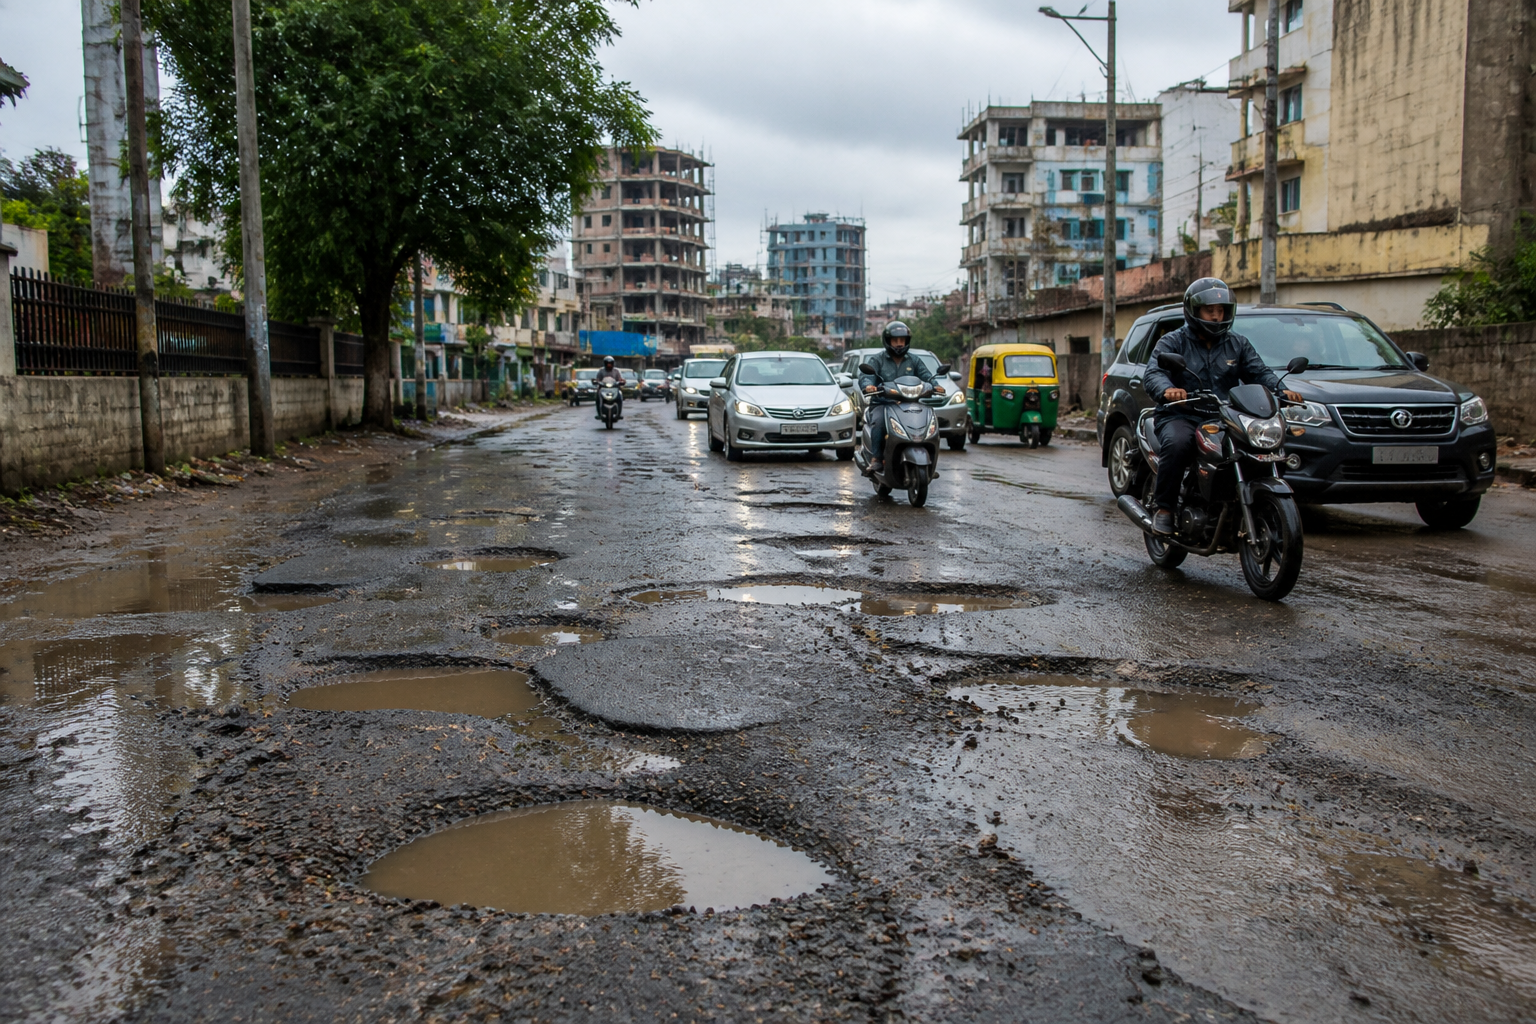
An AI-powered survey has identified 14,393 potholes across 2,493.5 km of roads under the Bengaluru North City Corporation, revealing a road network where a pothole appears roughly every 173 metres. The number is more than a seasonal complaint: it provides a measurable picture of how road maintenance is being experienced across 72 wards, and raises questions about whether repair spending is producing durable results.
The survey recorded an average of 5.8 potholes per kilometre. But the citywide average conceals sharp differences between areas. Byatarayanapura accounted for 5,964 potholes, or 41.4% of the total identified. Rajarajeshwarinagar recorded the highest density, at 10.4 potholes per kilometre. Together, these figures show that the problem is not evenly distributed and that ward-level road conditions can differ significantly from the broader average.
That uneven distribution matters for governance. A citywide pothole count can establish the scale of the problem, but it does not by itself explain why some areas carry a much larger burden. The concentration in Byatarayanapura, represented by Greater Bengaluru Development Minister Krishna Byre Gowda, makes the constituency-level figure especially significant in the public debate over road quality. It also offers civic agencies a more precise basis for prioritising repairs than general complaints about poor roads.
The survey’s use of artificial intelligence changes the nature of the evidence available to civic authorities. Residents have long reported damaged roads through daily experience, photographs and complaints. An automated road survey, as described in the report, converts those visible defects into a quantified inventory covering distance, wards and pothole density. That does not establish the cause of every pothole, nor does it assess the quality of every repair. It does, however, provide a systematic indication of the condition recorded across the surveyed road network.
For commuters, the consequences are immediate. Srinivas Sudheer, who runs a company in Peenya, described the Jalahalli Cross-Peenya Second Stage stretch as a clear example of the problem. He said the number and size of potholes made the road more than an inconvenience for motorists and raised questions about the quality and upkeep of city roads. His account connects the survey’s numerical findings with the experience of travelling through an important industrial and employment corridor.
Prasanna Kumar, a technology worker living in Nagarbhavi, said potholes had become a perennial problem in Bengaluru. He argued that the recurring explanation of excessive rain did not fully account for the condition of roads this year, when the city had not experienced the kind of heavy rainfall seen in previous years. In his assessment, recent rain had made existing potholes more visible and dangerous, while the underlying concern was the quality and timing of repairs.
The distinction between damage caused by rain and damage revealed by rain is central to the road-maintenance question. The report does not establish that rainfall is irrelevant. Roads can deteriorate faster when water enters cracks or accumulates on damaged surfaces. But the resident accounts indicate that rain is being viewed as an incomplete explanation when defects persist beyond the immediate weather event. If potholes return repeatedly, the issue shifts from emergency response to the durability of road construction, drainage conditions, inspection systems and repair execution.
This is where the reported ₹750-crore repair announcement becomes important. The State government announced the allocation in September 2025, yet residents continue to question road quality. The existence of a large repair programme does not, by itself, demonstrate that roads have improved. The survey’s findings instead show that substantial public spending and visible road distress can coexist, making implementation and monitoring as important as the amount announced.
The available report does not provide a project-wise account of how the ₹750 crore was allocated, which roads were repaired, what construction standards were applied, or how completed work was inspected. It also does not establish how many of the 14,393 potholes fall on roads repaired under the announcement. Those gaps are significant because the central public concern is not only how many potholes exist, but whether expenditure is preventing the same roads from deteriorating again.
A pothole count can therefore serve two different administrative purposes. First, it can support short-term repairs on dangerous stretches. Second, if tracked over time, it can help evaluate whether repairs last. The current figures provide a baseline for the surveyed road network: 14,393 detected potholes, 2,493.5 km covered, 72 wards assessed and major differences in both total burden and density. A future comparison would be needed to determine whether the condition is improving, remaining stable or worsening.
The distinction between total numbers and density is particularly useful. Byatarayanapura’s 5,964 potholes give it the largest reported burden by far, accounting for 41.4% of the survey total. Rajarajeshwarinagar’s 10.4 potholes per kilometre, meanwhile, indicate the highest concentration relative to road length. These are different measures of road distress. One identifies where the largest number of defects was found; the other identifies where road users may encounter defects most frequently over a given distance.
That distinction can influence how civic agencies plan interventions. A ward with the highest total count may require extensive work across a wide network, while a ward with the highest density may require concentrated attention on particular stretches. Without ward-level repair, traffic and road-quality data beyond what is provided in the report, it is not possible to determine which approach would deliver the greatest benefit. The survey nevertheless makes a case for moving away from uniform, citywide repair narratives.
The problem also exposes the limits of treating pothole repair as a purely monsoon-linked activity. If damaged roads remain unrepaired before the rains, water can make the defects more visible and hazardous. If repairs are carried out without addressing the conditions that caused the damage, the work may not provide lasting relief. The supplied evidence does not identify the technical reasons for each failure, but the persistence of potholes despite repeated repair discussions makes road quality and maintenance timing unavoidable parts of the institutional question.
For residents and businesses, poor road quality creates a daily reliability problem. Sudheer’s comments about the Peenya stretch point to the effect on people travelling to work and operating businesses. Kumar’s account from Nagarbhavi reflects the recurring nature of the disruption. The report does not quantify vehicle damage, travel-time losses, accidents or healthcare costs, so those impacts cannot be measured from the available evidence. Their absence from the data, however, also shows why a pothole inventory should be connected to broader road-safety and mobility monitoring.
The survey further raises a question about the relationship between technology and accountability. Artificial intelligence can help identify and count defects at a scale that manual inspections may struggle to match. But detection is only the first stage. The civic value of such a system depends on what follows: whether each reported defect is verified, assigned for repair, completed within a stated timeline and checked after work. The supplied report does not say whether such a tracking system exists, leaving the administrative process after detection unclear.
That uncertainty is important because the city’s road problem is not presented as a lack of public awareness. Commuters already know where roads are difficult to use. What the AI survey adds is a common evidence base that can potentially connect complaints, budgets and outcomes. If the numbers are used only to announce another round of repairs, the exercise may remain a count of defects. If they are linked to contracts, ward priorities and post-repair inspections, they could become a tool for evaluating performance.
The evidence currently confirms three things. Bengaluru North has a large recorded pothole burden across a substantial road network; the burden is heavily concentrated in particular wards; and residents do not regard seasonal rain as a sufficient explanation for recurring road failures. It does not yet confirm how many defects resulted from poor construction, delayed maintenance, drainage problems or new damage, nor does it show how the announced repair funds were spent.
The next stage of scrutiny will therefore depend on the civic response to the survey. The most consequential questions are whether the 14,393 locations will be publicly mapped, how repair priorities will be set, which agency or contractor will be responsible for each stretch, and whether the roads will be inspected after repairs. Until those links between detection, spending and outcomes are established, Bengaluru’s pothole count will describe the scale of the problem more clearly than the city has been able to explain why it keeps returning.
