


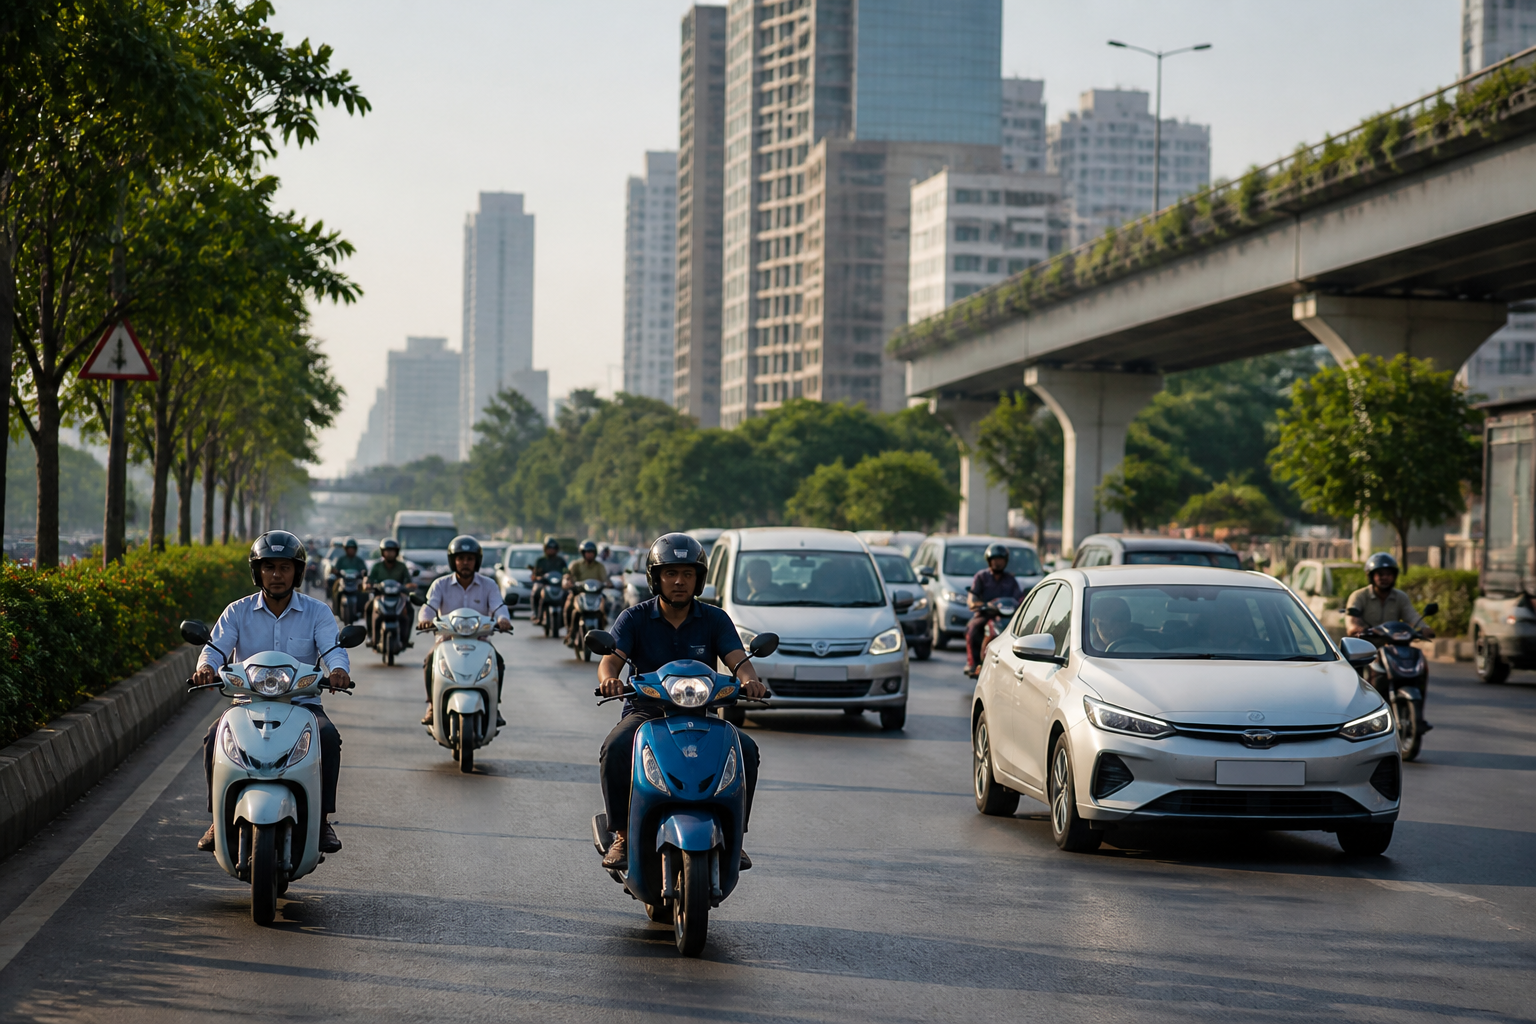
Mumbai EVs have crossed a visible threshold. The city now has 77,196 registered electric vehicles, according to figures reported around World EV Day on September 9. The number places electric mobility firmly within Mumbai’s transport landscape, but the composition of that fleet also shows where the transition is taking place: primarily among two-wheelers, with electric cars forming a smaller share.
The same data puts Maharashtra’s total electric-vehicle population at about 11.5 lakh, making it India’s second-largest state EV market after Uttar Pradesh, which has around 18 lakh electric vehicles. Karnataka follows with approximately 9 lakh. These figures offer a snapshot of adoption, but they also raise a more important urban question: whether registration growth is being matched by the affordability, infrastructure and policy support needed for electric mobility to become a durable part of city transport.
The reported numbers do not establish that Mumbai has completed a transport transition. They show that electric vehicles are becoming more common within the existing system. Understanding that distinction matters because a larger EV fleet does not, by itself, reveal how vehicles are used, where they are charged, whether they replace petrol or diesel vehicles, or how much they contribute to reducing emissions and operating costs. Those questions are not answered in the supplied data, but they define the next stage of the city’s mobility challenge.
Mumbai’s EV fleet is led by two-wheelers
Of Mumbai’s 77,196 registered electric vehicles, 40,086 are e-bikes and 30,137 are e-cars. The remaining vehicles belong to other electric-vehicle categories. E-bikes therefore account for the largest identified segment of the city’s fleet, while electric cars represent a substantial but smaller share.
The pattern is consistent with the basic affordability question highlighted in the report. A transport analyst from the Mumbai Mobility Forum said that stronger purchase incentives and subsidies, combined with lower battery-manufacturing costs, could reduce vehicle prices and make electric cars more accessible. The comment points to the importance of upfront cost in determining who can participate in the transition, particularly in the passenger-car market.
The supplied figures do not provide a comparison with Mumbai’s total registered vehicle population, so they cannot establish the overall share of EVs in the city’s fleet. Nor do they show annual registration growth or the number of vehicles that remain active. What they do establish is the scale of the registered base and its broad composition. The city’s electric mobility market is no longer limited to a small group of early adopters, but it remains concentrated in specific vehicle categories.
Maharashtra’s state-level numbers make that concentration clearer. Of the approximately 11.5 lakh EVs in the state, around 9.6 lakh are e-bikes. More than 1 lakh are e-cars, with the balance comprising other categories. The state’s adoption story is therefore overwhelmingly driven by electric two-wheelers. That matters for urban planning because two-wheelers have different charging, parking and road-space requirements from cars, buses, commercial vehicles and three-wheelers.
Adoption is distributed unevenly across Mumbai
The figures reported for Mumbai’s regional transport office areas show that the city’s EV presence is not evenly distributed. Andheri has the largest combined count of e-BOVs and pure EVs among the jurisdictions listed, with 11,553 e-BOVs and 8,836 pure EVs, taking its combined total to 20,389.
Borivli follows with 10,989 e-BOVs and 6,218 pure EVs, for a combined 17,207. Wadala has 8,830 e-BOVs and 8,860 pure EVs, while Tardeo has 13,608 e-BOVs and 8,302 pure EVs. These numbers indicate substantial electric-vehicle presence across several major RTO jurisdictions, although the supplied report does not provide a complete ranking of every jurisdiction or explain the difference between the e-BOV and pure-EV classifications.
The geographic distribution is significant because adoption is shaped by more than vehicle availability. It is affected by household purchasing power, commuting distances, parking conditions, access to electricity and the ability to charge at home or at work. The RTO-level figures do not identify which of these factors is driving adoption in each area. They do, however, show that electric vehicles are present across multiple parts of Mumbai rather than being confined to a single neighbourhood or administrative zone.
A fuller assessment would require additional data: the location and capacity of public chargers, the number of home and workplace charging points, vehicle-use patterns, fleet turnover and registrations by income or vehicle purpose. None of these indicators is included in the supplied report. As a result, the current figures are best understood as a measure of registered presence, not a complete account of the city’s electric-mobility performance.
Maharashtra’s position reflects policy and market conditions
Maharashtra’s second-place national ranking is presented alongside the state’s efforts to encourage cleaner mobility. The report identifies purchase incentives and subsidies as part of that policy push, while also citing lower battery-manufacturing costs as a factor that could accelerate adoption. These measures operate at different points in the market. Incentives can reduce the upfront price paid by consumers, while cheaper batteries can affect the underlying cost of vehicles.
The ranking also shows how state policy and market conditions interact. Maharashtra has about 11.5 lakh EVs, compared with Uttar Pradesh’s 18 lakh and Karnataka’s approximately 9 lakh. The figures place Maharashtra between two large state markets, but they do not explain the reasons for the differences. The supplied material contains no state-by-state comparison of population, vehicle registrations, subsidy levels, charging infrastructure or commercial-fleet adoption.
That missing context limits what can be concluded from the ranking alone. A larger registered fleet may reflect stronger incentives, a larger overall vehicle market, greater commercial use or other conditions that are not captured here. The figures establish Maharashtra’s position, but not a single cause for it.
The same caution applies to the relationship between policy and adoption. The report says officials and industry observers have pointed to incentives, subsidies and lower battery costs as factors that could support growth. It does not provide a quantified assessment of how many registrations resulted from a particular subsidy, how long incentives have been available, or whether adoption changed after a specific policy intervention. Those are important questions for evaluating the effectiveness of the state’s EV strategy.
The infrastructure question remains open
As Mumbai’s registered EV population grows, the city’s mobility system must accommodate vehicles with different charging needs and usage patterns. The supplied data does not include the number of charging stations or the distribution of charging access. It therefore cannot establish whether current infrastructure is adequate for the 77,196 registered vehicles, or whether charging availability is already influencing where and how residents adopt EVs.
This gap is particularly relevant because the fleet is dominated by e-bikes and includes more than 30,000 electric cars. Two-wheelers may require different charging arrangements from cars, while residents without dedicated parking may face different constraints from those with private spaces. Commercial and personal vehicles may also have different daily travel patterns. The registration numbers identify the scale of demand, but not the infrastructure required to support it.
The policy challenge is consequently broader than adding more vehicles to the roads. It includes maintaining reliable charging access, ensuring that incentives reach intended users, reducing upfront costs and clarifying how different vehicle categories fit into the city’s transport network. The report directly supports the importance of incentives and battery costs; it does not provide evidence on charging reliability, grid capacity or enforcement, so those issues remain unmeasured in the available material.
What the current numbers confirm
The latest figures confirm three points. Mumbai has recorded 77,196 electric vehicles. Electric two-wheelers form the largest identified part of the city’s fleet, with 40,086 e-bikes, while e-cars account for 30,137 vehicles. And Maharashtra’s estimated 11.5 lakh EVs make it the country’s second-largest state EV market in the reported comparison.
They also show that adoption is distributed across several Mumbai RTO areas, with Andheri recording the highest combined count among the jurisdictions listed. At the state level, the dominance of e-bikes is even more pronounced, with about 9.6 lakh of the total 11.5 lakh EVs belonging to that category.
What remains uncertain is equally important. The supplied figures do not show the EV share of Mumbai’s entire vehicle fleet, the pace of year-on-year growth, charging infrastructure, vehicle utilisation or the emissions impact of the transition. They also do not quantify the effect of subsidies or lower battery costs. The next useful stage of public reporting would therefore be to connect registration data with infrastructure and usage data.
For now, Mumbai’s 77,196 registered EVs mark a significant expansion of electric mobility in the city, while Maharashtra’s state-level ranking shows the scale of the wider market. Whether that growth becomes a dependable urban transport transition will depend on how affordability, charging access and policy support develop alongside registrations.
