


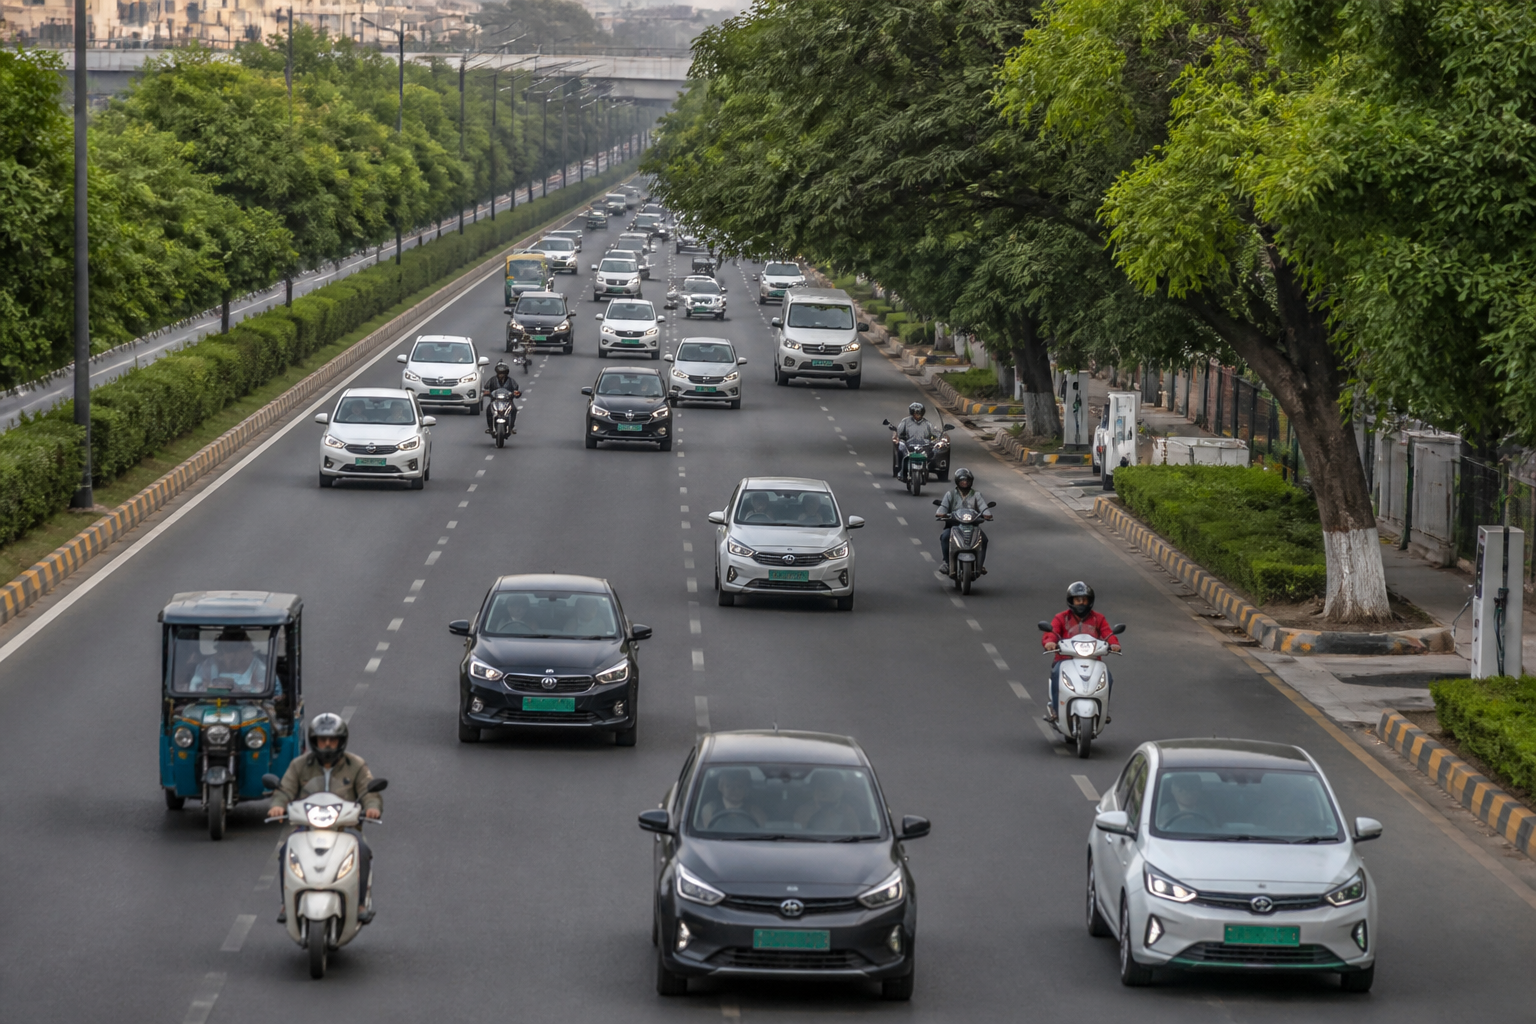
India’s passenger-vehicle market has reached a point where alternatives to petrol are no longer a marginal consumer choice. In August, CNG, hybrid and electric cars together accounted for 41.9% of passenger-vehicle retail sales, edging past petrol-powered cars at 40.8%, according to figures reported by the Federation of Automobile Dealers Associations, or FADA. The change is important not because one technology has replaced another, but because buyers are increasingly choosing among several alternatives based on running costs, efficiency, vehicle use and the availability of supporting infrastructure.
The figures point to a more complicated mobility transition than a simple movement from internal-combustion engines to electric vehicles. CNG accounted for the largest share among the alternative powertrains at 25.2% of passenger-vehicle retail sales. Hybrids contributed 9%, while electric vehicles accounted for 7.6%. Diesel cars made up 17.2% of the market. Petrol remained the largest individual fuel category, but its lead over the combined alternative-fuel group disappeared during the month.
That distinction matters for how India’s cities plan transport infrastructure. A transition built around a single technology would require a relatively concentrated response, such as expanding charging networks for electric vehicles. The current market signal is more plural. CNG vehicles require access to refuelling networks, hybrids depend primarily on conventional fuel infrastructure while reducing fuel consumption, and EVs require charging access at homes, workplaces, public locations and fleet depots. The market is therefore creating several infrastructure demands at the same time.
The change also reflects the way households assess ownership costs. FADA attributed the movement towards alternative powertrains to running-cost economics and continuing hesitation around the E20 transition. The report did not suggest that petrol demand had disappeared. Instead, it showed that buyers were becoming more willing to select a different powertrain when the ownership calculation supported it. That calculation can include fuel expenditure, vehicle efficiency, charging convenience, the availability of service support and uncertainty over how existing vehicles will fit into future fuel systems.
CNG’s 25.2% share makes it the clearest example of this practical decision-making. It is the largest alternative to petrol in the passenger-vehicle market, and its growth has been supported by the prospect of lower running costs. Maruti Suzuki held around 71% of the CNG segment, according to the figures reported by Times of India. That concentration indicates that the CNG market is not evenly distributed across manufacturers, even as the fuel type becomes a more significant part of the overall passenger-vehicle mix.
Hybrids occupy a different position. Their 9% share suggests demand from buyers who want improved efficiency without depending on charging infrastructure. A hybrid can therefore serve as an intermediate choice for households that are interested in reducing fuel use but remain uncertain about the practical availability of charging. The data does not establish that hybrids will displace either petrol or electric vehicles. It does show, however, that the transition is allowing consumers to choose different technological pathways rather than moving through one uniform sequence.
Electric cars accounted for 7.6% of passenger-vehicle retail sales, while Tata Motors led electric passenger vehicles with around 43% share. EVs were not the largest alternative in passenger cars during the month, but their presence is part of a wider pattern across vehicle categories. Across all vehicle segments, electric-vehicle retail sales reached 2.98 lakh units in August, a 52.9% increase from a year earlier. The increase indicates that electric mobility is expanding, although the pace and scale of adoption differ sharply between passenger cars, two-wheelers, three-wheelers and commercial vehicles.
Two-wheelers offer an important urban signal because they form a large part of everyday commuting and delivery activity. Electric two-wheelers accounted for 10.7% of sales in August, compared with 7.7% a year earlier. The share crossed 10% in a non-festive month for the first time, according to the report. That detail is significant because it suggests the increase was not limited to a peak purchasing period. It also places electric scooters closer to the mainstream commuter market, rather than restricting them to early adopters.
The infrastructure implications for two-wheelers are different from those for cars. Many two-wheelers may be charged at homes or workplaces, but the practical experience still depends on access to reliable electricity, parking arrangements and the time required for charging. For delivery workers and other high-use riders, vehicle downtime and charging access can be more important than the headline purchase price. The supplied figures do not establish how these users are adopting electric vehicles, but the category-level growth shows that the transition is reaching a larger commuter base.
Three-wheelers are further along the electric transition. EVs accounted for 65.3% of three-wheeler sales in August, up from 56.6% a year earlier. This is not simply an early-stage increase from a small base. Electric vehicles already formed the majority of sales in the category, making three-wheelers the strongest example in the available data of a vehicle segment moving towards structural electrification.
The reasons for that performance are not detailed in the supplied material, so the figures do not by themselves establish whether operating economics, fleet use, financing, regulation or vehicle design was the decisive factor. They do, however, show that electrification can advance at very different speeds depending on how vehicles are used. A commercial or shared vehicle with high daily utilisation may face a different ownership calculation from a privately used passenger car. That difference is central to the way cities should read adoption data: overall averages can conceal major variation between transport segments.
Commercial vehicles are beginning from a much smaller base, but their electric share more than doubled to an all-time high of 5.2% from 2.1% a year earlier. The figure remains modest compared with the three-wheeler market, yet its direction suggests that electrification is beginning to move beyond pilots into fleet purchases. Commercial fleets may place greater emphasis on operating costs and utilisation, but they also require dependable charging or energy access, predictable routes and suitable vehicle availability. The current data confirms an increase in adoption, while leaving the scale and durability of that transition to be established by further reporting.
Taken together, the numbers describe a market being shaped by use case rather than by a single national preference. Passenger-car buyers are dividing their choices among CNG, hybrids and EVs, with petrol still retaining the largest individual share. Two-wheeler adoption is moving into double digits. Three-wheelers are already majority electric. Commercial vehicles are showing early growth from a low base. These are not interchangeable trends, and treating them as one uniform transition could lead to poorly targeted infrastructure or policy decisions.
The policy landscape implied by the figures is therefore not limited to vehicle sales. It includes the systems that make each powertrain usable. CNG adoption depends on the reach and reliability of refuelling infrastructure. Hybrid adoption depends less on new charging networks but remains linked to vehicle availability and consumer confidence. EV adoption requires a dependable charging ecosystem, along with electricity access and arrangements for vehicles that operate intensively or remain parked in shared spaces. The supplied report does not provide details of government subsidies, charging targets, fuel policy or municipal implementation, so the institutional responsibilities behind these systems cannot be assessed from the available evidence alone.
The E20 hesitation mentioned by FADA adds another layer to the consumer decision. The report identifies it as one factor nudging buyers towards alternatives, but does not quantify its effect or explain how concerns vary across vehicle types. It is therefore best read as a market sentiment signal rather than as proof of a single cause. The broader evidence points to several overlapping considerations: running costs, efficiency, technology and infrastructure confidence.
For urban administrations, this diversity changes the question from how quickly EVs are selling to how different forms of mobility are supported in the places where people live and work. Passenger cars, scooters, three-wheelers and commercial vehicles use roads differently, spend different amounts of time in operation and create different demands on refuelling, charging and parking systems. The figures suggest that the transition is already happening across these categories, but not at the same speed or through the same consumer logic.
The evidence confirms three things. First, alternative powertrains have become a major part of India’s passenger-vehicle market, even though petrol remains the largest single category. Second, electric adoption is strongest in three-wheelers and is expanding among two-wheelers, while passenger cars show a broader contest between CNG, hybrids and EVs. Third, commercial electrification is emerging but remains comparatively small. What remains uncertain is how durable these shares will be, how infrastructure will keep pace and how the market will evolve as consumers gain more experience with each technology. Those are the developments that will determine whether August represents a temporary crossover or a lasting change in India’s urban mobility system.
