


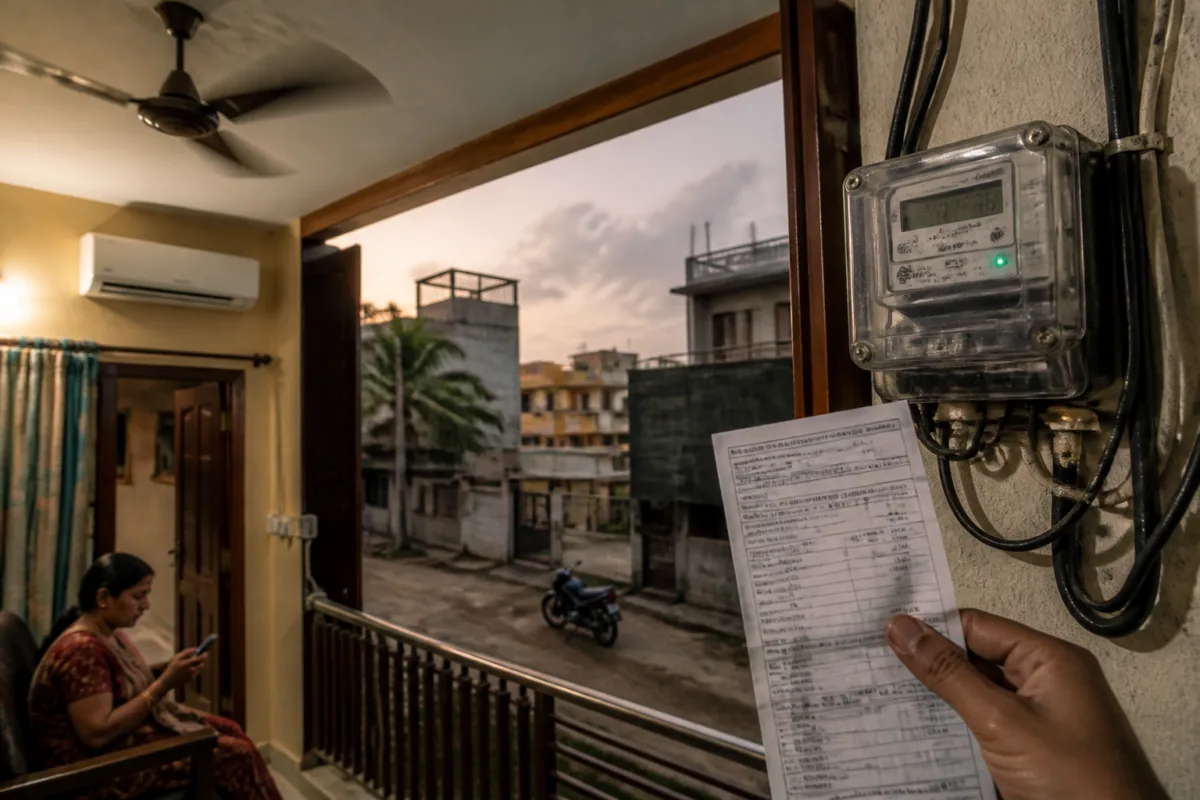
Warangal’s electricity bills have remained high even after the monsoon, challenging the assumption that household power consumption automatically falls once summer ends. The figures reported for the erstwhile undivided Warangal district show that rising demand is being shaped by several overlapping pressures: persistent heat and humidity, greater household consumption, agricultural pumping, more electricity connections and possible differences in billing periods or adjustments.
The immediate concern for consumers is straightforward. Many households expected electricity costs to ease during the rainy season, when air-conditioners and coolers are normally used less frequently. Instead, residents reported that bills remained elevated through the monsoon and into October. The explanation, according to the report, lies partly in weather conditions that extended the use of cooling appliances beyond the traditional summer period.
That explanation matters because electricity demand is not determined by season alone. It is also affected by how long appliances operate, how many households are connected to the grid, whether irrigation pumps are running, and how electricity use is measured and billed. The Warangal figures therefore point to a more complicated urban and regional energy pattern than a simple rise in household consumption.
## The numbers show a sharp rise, but not one single cause
Total billing in the erstwhile undivided Warangal district stood at ₹177.41 crore in January and rose to ₹367.13 crore in September before declining to ₹313.36 crore in October. Compared with the corresponding months of the previous year, billing was higher by ₹130.03 crore in September and ₹111.98 crore in October.
These figures indicate a substantial increase in the amount billed across the district. They do not, by themselves, establish that domestic consumers alone caused the rise. The billing totals include multiple categories of electricity users, including households, agricultural consumers, commercial establishments and industrial users. Changes in the number of connections, meter-reading schedules and billing periods may also affect the total amount recorded in a particular month.
That distinction is important for public understanding. A higher district-wide bill can reflect increased electricity use, a larger consumer base, changes in the timing of meter readings, tariff-related factors or billing adjustments. Without category-wise data, the total cannot show how much of the increase came from households and how much came from other parts of the economy.
The available domestic consumption figures provide a clearer, though still partial, picture. As of October 26, domestic consumption had increased from 403.60 million units in October 2025 to 453.08 million units in October 2026. The increase of 49.48 million units represents approximately 12.26% growth.
The number of domestic connections also rose during the period, from 41,97,309 to 44,63,350. This means that part of the increase in total household consumption is associated with a larger number of connections. However, average consumption per connection also increased, from 96.16 units to 101.51 units. The data therefore indicates both expansion in the number of consumers and higher average use among connected households.
## Weather has extended cooling demand
The reported weather pattern provides one explanation for why electricity use did not fall as expected during the monsoon. Above-normal daytime temperatures and persistent humidity kept air-conditioners, coolers and fans running for longer. In many homes, the period when cooling appliances are used appears to have extended beyond the peak summer months.
This matters particularly in urban and semi-urban areas where cooling demand can quickly become a household budget issue. Even when the increase in daily use is modest, operating several appliances for longer periods can raise monthly consumption. The effect is not uniform: households with air-conditioners may experience a different increase from those using fans or coolers, while homes with different occupancy patterns will also have different demand profiles.
The report also refers to India Meteorological Department forecasts indicating the possibility of above-normal temperatures in October. It notes concerns about strengthening El Niño conditions and changing weather patterns. However, El Niño alone cannot explain an individual household’s electricity bill. The final amount depends on actual consumption, applicable tariffs, meter-reading intervals and any billing adjustments.
This is a crucial qualification. Weather can increase the need for cooling, but it does not replace the need to check the billing record. A consumer seeking an explanation needs to know whether the billed units match the meter reading, whether the reading period was longer than usual, and whether any additional charges or adjustments were applied.
## Agricultural demand adds pressure to the system
Household consumption is only one part of the demand picture. Farmers dependent on groundwater have reportedly been operating borewell pumps for longer periods because of inadequate rainfall and dry spells. Longer pumping hours can increase agricultural electricity use even when rainfall has technically ended the monsoon season.
This creates an important connection between regional weather conditions, rural production and the wider electricity system. A period that is uncomfortable for households because of heat and humidity can also be difficult for farmers because of insufficient rainfall. The result is simultaneous pressure from cooling demand in homes and irrigation demand in agricultural areas.
The reported peak electricity demand for Telangana reached an all-time high of 20,003 MW on October 15. The demand figure covers domestic, agricultural, commercial and industrial requirements across the state. It cannot be used to calculate the specific contribution of Warangal households, but it shows that the increase in electricity requirements is not confined to one consumer category or one locality.
The combination of higher peak demand and higher household consumption raises operational questions for electricity distribution. Utilities must meet demand when it occurs, while consumers need bills that clearly show how much electricity they used and over what period. These are related but separate responsibilities: supplying enough power does not by itself resolve concerns about billing accuracy.
## The missing evidence is category-wise transparency
The central gap identified by the consumer concerns is the absence of a detailed public breakdown. District-level billing totals show the scale of the change, but they do not explain its composition. Category-wise electricity consumption and billing data could help separate domestic, agricultural, commercial and industrial trends.
The number of domestic connections is another essential part of that explanation. Since connections rose from 41,97,309 to 44,63,350, total domestic consumption would be expected to increase even if the average use of each connection remained unchanged. The reported rise in average consumption, from 96.16 units to 101.51 units, indicates that connection growth was not the only factor. Yet the available figures do not establish how much of the increase was caused by cooling appliances, household size, appliance ownership or other forms of domestic use.
Billing-period information is equally important. If meter readings are taken at different intervals, a bill covering more days can appear unusually high even when daily consumption has not changed by the same proportion. Similarly, corrections or adjustments can alter the amount payable without representing current-month appliance use. The report does not provide a detailed breakdown of these factors.
For consumers, the practical issue is therefore not merely whether bills are high. It is whether the bill provides enough information to explain the increase. A transparent bill should allow a household to compare the current reading with the previous reading, identify the number of billed units, understand the billing dates and see any additional charges or adjustments.
## What the Warangal figures reveal about urban energy stress
The Warangal case shows how household energy costs are increasingly connected to conditions outside the home. Weather affects cooling demand. Rainfall affects irrigation pumping. Connection growth expands the number of users. Billing systems determine how consumption is recorded and communicated. These factors can converge in the same month, making a single explanation inadequate.
The figures also show why demand should be assessed through more than one measure. Total billing rose sharply, but domestic connections also increased. Average household consumption rose as well, but the report does not provide a full category-wise account of tariff changes, billing periods or adjustments. State peak demand reached 20,003 MW, but that number covers a wider geography and all major consumer categories.
What the evidence confirms is that electricity use remained elevated after the usual summer period, domestic consumption increased year on year, the number of household connections grew and agricultural pumping added to demand pressure. What remains unresolved is the precise contribution of each factor to individual bills and district-wide billing totals.
Electricity officials have been urged to verify meter readings, ensure that billed units correspond to actual consumption and clarify additional charges or changes in billing periods. Consumers have also sought the release of category-wise consumption and billing data. Those steps would provide the evidence needed to distinguish higher usage from billing-timing effects and other adjustments as households continue to face elevated costs beyond the peak summer season.