


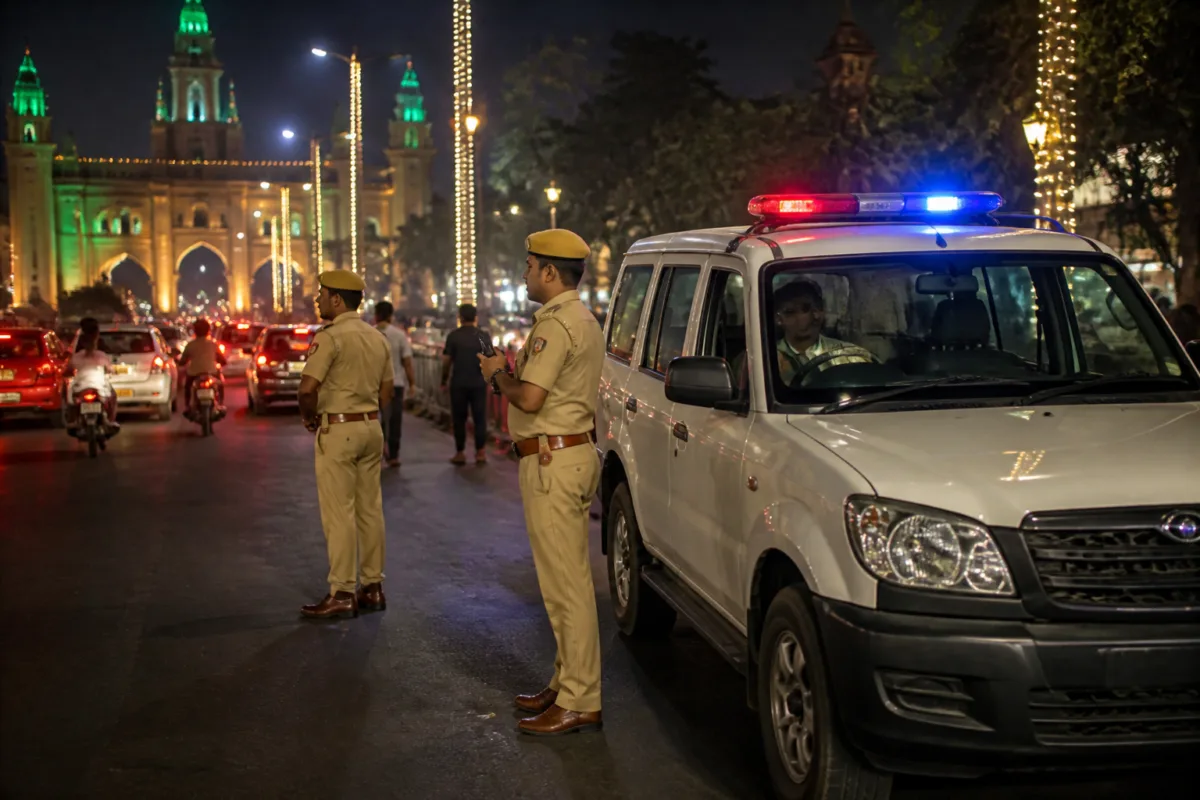
UP-112 handled 2,05,738 distress cases across Uttar Pradesh during the three-day Diwali period from November 7 to 9, according to figures released by its headquarters. The number was more than five times the service’s stated normal daily average of about 38,000 cases on each of the three festival days, turning the period into a large-scale test of how police, ambulance and fire-response systems absorb sudden demand.
The surge was not evenly distributed. UP-112 recorded 53,264 incidents on Chhoti Diwali, 74,816 on Diwali and 77,753 on November 9. The final day was therefore the busiest of the three, even though the festival’s main celebration took place on November 8. The figures point to a prolonged demand peak rather than a single evening of exceptional activity.
That distinction matters for emergency administration. A system facing a short, sharply defined spike can concentrate vehicles and personnel for a limited period. A three-day increase requires sustained staffing, control-room coordination and vehicle availability across locations. The report says that personnel were kept on heightened alert and round-the-clock duty across Uttar Pradesh after preparations were stepped up on the directions of DG UP-112 Binod Kumar Singh.
The figures also show that emergency demand during a major festival is not limited to one type of incident. Police assistance formed the largest part of the workload, while medical and fire-related calls added separate pressures on response networks and their partner departments.
## UP-112 Diwali emergency calls show a multi-service burden
Police-related requests rose from around 41,000 on November 7 to nearly 56,000 on Diwali and about 59,000 on November 9. Police Response Vehicles were deployed across cities and villages to handle disputes, law-and-order situations, public-safety concerns and other urgent complaints.
The police figures explain much of the overall increase, but they should not obscure the operational complexity of the remaining cases. UP-112 facilitated ambulance assistance in 36,817 cases over the three days. These calls required coordination with health services for patients needing urgent support, making the emergency system dependent on more than the availability of a police response vehicle.
Fire-related emergencies accounted for 7,029 incidents. The report links the increase to extensive fireworks use and higher public activity during the festival. These incidents required coordination between UP-112 control rooms, Police Response Vehicles and the fire department. In practice, that means the same emergency communications system had to manage different types of risk while public movement and activity were elevated.
The supplied figures do not provide a detailed location-wise distribution, response-time breakdown, outcome data or comparison with previous Diwali periods. They therefore establish the scale and composition of the workload, but not whether response performance improved, deteriorated or remained stable during the surge.
## The demand was spread across cities and villages
One important feature of the response described in the report is its geographic scope. UP-112 deployed Police Response Vehicles across cities and villages, indicating that the festival-related burden was treated as a state-wide emergency-management requirement rather than a problem confined to major urban centres.
This matters because a state-wide deployment has to account for different operating environments. In cities, emergency teams may face dense public activity and disputes in heavily used areas. In villages, longer distances and dispersed settlements may affect how vehicles and personnel are positioned. The report does not provide a breakdown that would allow these conditions to be compared, but its reference to both cities and villages shows the breadth of the planning challenge.
The emergency network also had to remain available for routine needs while handling the festival increase. The reported daily average of about 38,000 cases provides a baseline against which the three-day total can be understood. The service did not stop receiving ordinary emergencies during Diwali; instead, those demands were added to a period of increased public activity, travel, celebrations and late-night movement.
That is why the total cannot be read only as a count of festival incidents. It is also a measure of the additional load placed on a public-response platform that continued to serve several kinds of distress simultaneously. Without information on staffing numbers, vehicle availability or average response times, the data cannot show precisely how that load affected performance. They do show that demand rose sharply and remained high for three consecutive days.
## Emergency planning included welfare services
The report also records two forms of welfare assistance alongside police, ambulance and fire responses. Under the Savera Scheme, teams helped 2,018 registered senior citizens during the festival period. Under the Escort for Women Safety initiative, Police Response Vehicles escorted 11 women who were travelling alone and reported being stranded without transport late at night.
The escort service was available between 10 pm and 6 am. Its inclusion in the festival figures expands the definition of emergency response beyond incidents that are conventionally classified as crime, injury or fire. A person stranded late at night may require protection and mobility assistance even when no offence has been reported. Similarly, support for registered senior citizens places emergency administration within a wider public-safety and welfare role.
These interventions were much smaller in number than the police-related or ambulance cases. Their significance lies in the type of service provided: assistance was extended to people facing vulnerability or mobility constraints during a period when normal transport and support arrangements may have been more difficult to access. The supplied report does not state how these cases were distributed geographically or how quickly they were resolved.
## What the figures confirm—and what they do not
The most defensible conclusion from the data is that Diwali generated an exceptional and sustained increase in emergency-service demand across Uttar Pradesh. The three-day total of 2,05,738 cases, together with the daily figures, establishes the scale of the surge. The category totals show that police requests dominated, but medical assistance and fire emergencies were also significant components of the workload.
The figures also confirm that coordination was central to the response. Police Response Vehicles were used for police assistance and welfare interventions, while medical cases were linked to ambulance support and fire cases required coordination with the fire department. UP-112 therefore functioned as an access and coordination point across several emergency services rather than as a standalone police channel for the period covered.
However, the report does not establish several measures that would be necessary to assess system performance. There is no information on average or median response times, the number of calls that required multiple services, the number of cases closed on site, ambulance availability, fire-department deployment or the outcomes of medical and fire incidents. There is also no year-on-year comparison in the supplied material.
Those omissions do not reduce the value of the reported workload figures, but they define their limits. A high number of calls can indicate increased risk, better access to emergency services, more active reporting, or a combination of these factors. The supplied evidence does not distinguish between those possibilities. It records how much demand the system handled, not why every call was made or how each case ended.
## The larger urban-service question
For cities and settlements, the central issue is not only whether an emergency number remains operational during a festival. It is whether the wider response network can expand temporarily without weakening everyday service. Diwali creates a predictable period of elevated activity, yet the reported demand still climbed from 53,264 cases on November 7 to 77,753 on November 9. That pattern makes preparedness, deployment and inter-agency coordination important administrative functions.
The UP-112 figures provide a useful snapshot of demand pressure across a large and varied geography. They show that public safety during a major festival depends on a combination of police vehicles, control rooms, ambulance coordination, fire response and welfare support. They also show why emergency planning cannot be assessed only through headline incidents: thousands of requests may involve disputes, medical needs, fires, vulnerable residents or people stranded late at night.
The next layer of public accountability would be performance data that connects call volumes with response times, outcomes and local deployment. Those details are not included in the supplied report. For now, the available evidence confirms that Uttar Pradesh’s emergency system faced a three-day Diwali surge of 2,05,738 cases, with the highest daily workload recorded on November 9 and police assistance accounting for the largest share.