


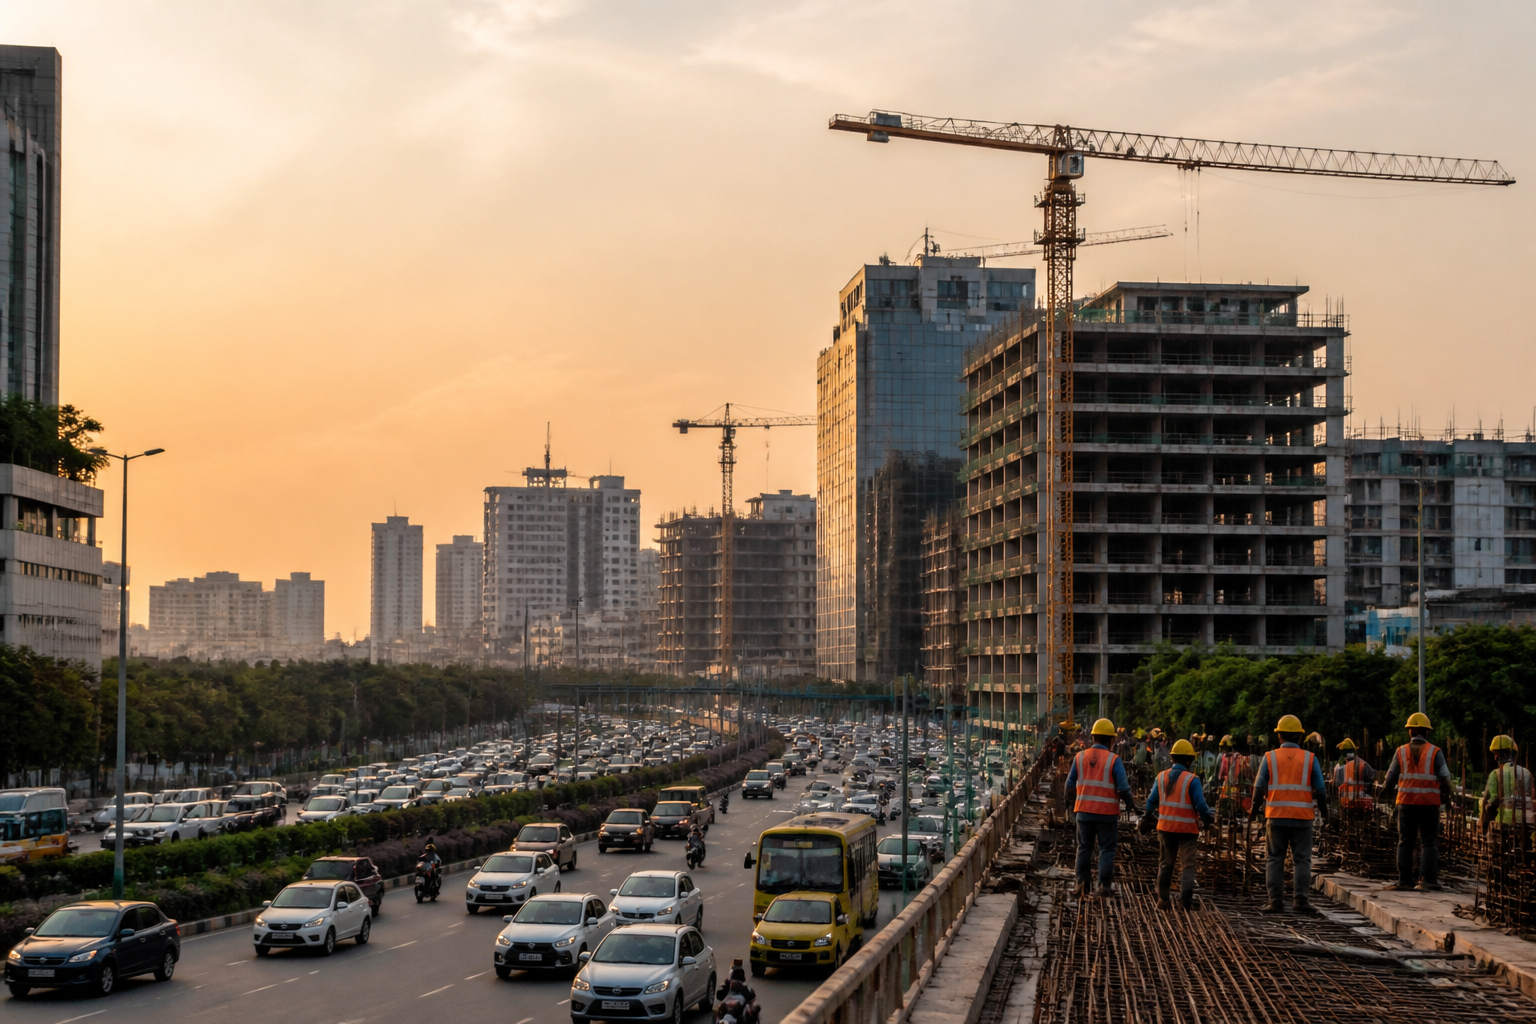
Telangana’s tax revenue reached ₹44,372 crore in the first half of 2026-27, a 16% increase over the corresponding period last year. The headline number is significant not only because it shows stronger government receipts, but also because the composition of that growth points towards the sectors shaping the state’s urban economy: construction, real estate, automobiles, finance, banking, electronics and communication.
The figures released by the commercial taxes department show that collections under Goods and Services Tax (GST), value-added tax (VAT) and profession tax rose from ₹38,269 crore during April-September last year to ₹44,372 crore this year. The increase of ₹6,103 crore was led by GST, which contributed ₹3,988 crore, or nearly two-thirds of the overall rise.
That distinction matters. A state’s own tax revenue is not simply a measure of administrative performance. It is also a record of economic transactions that the tax system is capturing. When GST collections rise, the increase can reflect higher sales, more formalised transactions, greater construction activity, stronger service-sector turnover or improved compliance. The supplied figures do not establish how much each factor contributed, but they do show that GST has become the principal source of growth within Telangana’s three reported tax heads.
GST collections increased 19%, from ₹21,061 crore in the first half of the previous year to ₹25,049 crore. GST accounted for 56% of the total collections under the three heads. VAT collections, primarily linked to petrol and liquor, rose 13% to ₹18,824 crore from ₹16,708 crore. Profession tax remained broadly unchanged at ₹499 crore, with officials describing the figures as provisional.
The pattern provides a useful window into the relationship between Telangana’s fiscal position and its urban development model. The commercial taxes department identified automobiles, works contracts, construction, real estate-related activities, finance and banking, and electronics and communication among the key sectors driving GST collections. These are sectors with a strong connection to urban expansion, particularly in and around Hyderabad, where construction, property transactions, contracting and higher-value services form an important part of the economic base.
However, the figures should not be read as a direct measurement of the welfare of urban residents. Tax growth shows the value of taxable economic activity and the government’s ability to collect revenue; it does not by itself indicate whether housing has become more affordable, whether public transport has improved, or whether municipal services are keeping pace with population and construction growth. A growing tax base can strengthen the state’s capacity to fund infrastructure, but the data supplied does not show how the additional receipts will be allocated.
GST’s growing role is not a new development in Telangana’s public finances. The Comptroller and Auditor General’s audit report, as cited in the report, found that State GST was the single largest component of the state’s own tax revenue between 2019-20 and 2023-24, accounting for around 41-42% of the total. The first-half figures for 2026-27 suggest that this structural dependence has continued, with GST now contributing more than half of the three tax heads covered in the latest collection data.
This creates both strength and exposure. GST provides a broad base that can capture activity across goods and services, including formal transactions associated with construction, real estate and urban consumption. At the same time, dependence on GST means that the state’s fiscal performance is closely tied to the pace and form of economic activity that generates such transactions. The figures do not establish whether the current growth is broad-based across Telangana or concentrated in particular sectors and locations. That distinction would be important for assessing the durability of the trend.
The role of construction and real estate is especially relevant to the built environment. Works contracts and property-related activity generate tax-linked transactions while also reflecting the physical transformation of cities. New buildings, infrastructure projects, vehicle purchases, financial services and communications activity can all expand the taxable economy. But revenue growth from these sectors can coexist with pressure on land, housing, roads, water supply and other urban systems. Tax collection therefore captures one side of urban expansion: the economic value created or recorded through transactions. It does not capture the full cost of providing infrastructure to support that expansion.
The monthly figures reinforce the broader trend but also show that the tax mix is not uniform. In September, collections under GST, VAT and profession tax rose 15% year-on-year to ₹7,303 crore, compared with ₹6,368 crore in September last year. GST collections increased to ₹4,184 crore from ₹3,646 crore, while VAT rose to ₹3,045 crore from ₹2,645 crore. Profession tax declined 4%, from ₹77 crore to ₹74 crore.
The September numbers show that GST and VAT both contributed to monthly growth, while profession tax remained a small and weaker component. This is consistent with the half-year picture in which GST and VAT accounted for the entire reported increase, while profession tax stayed almost flat. It also underlines the difference between taxes linked to transactions and taxes linked to employment or professional income. The supplied figures do not provide an explanation for the decline in September profession tax, so its significance should not be overstated.
The CAG context introduces an important caution. While the audit report recorded substantial growth in Telangana’s own tax revenues over the period it examined, it also noted that collections in 2023-24 fell short of budget estimates by ₹3,206 crore. This shows why actual collections and projected collections must be considered separately. Strong year-on-year growth can improve the fiscal position while still falling below the assumptions built into a budget.
For urban governance, the distinction has practical consequences. State and local authorities need reliable revenue to maintain roads, public transport systems, drainage, water infrastructure, waste management and other services. Yet a collection increase cannot automatically be treated as available spending space. The state’s overall fiscal commitments, transfers, debt obligations and spending priorities determine how much of the additional revenue can support urban infrastructure. None of those allocations is specified in the supplied material.
The figures also raise questions about the geography of revenue generation. The report identifies sectors associated with cities, but it does not break collections down by district, municipality or economic activity. Without that detail, it is not possible to determine how much of the growth originated in Hyderabad, other urban centres or non-urban areas. Nor is it possible to establish whether the increase reflects new investment, higher consumption, improved compliance or a combination of these factors.
That missing granularity is important because Telangana’s urban economy is not a single system. Hyderabad’s real estate, technology-linked services, finance, construction and communications sectors may have a different tax profile from smaller cities and towns. A statewide rise can therefore conceal uneven growth. The available data confirms the direction of movement but does not yet show how widely its benefits or pressures are distributed.
The immediate evidence is nevertheless clear. Telangana’s own tax collection under GST, VAT and profession tax strengthened in the first half of 2026-27, GST was the main driver, and sectors connected to construction and real estate were among those identified by officials as contributors. The trend continues a longer pattern in which State GST has been the largest component of own tax revenue.
The larger urban question is whether stronger revenue mobilisation will be matched by transparent and adequate investment in the systems that support growth. The current figures establish a stronger fiscal inflow, not its final public outcome. Future budget performance, district-level tax data, sector-wise trends and expenditure allocations will be necessary to determine whether the revenue surge represents broad-based urban economic strength or a narrower expansion concentrated in a few high-value sectors.
