


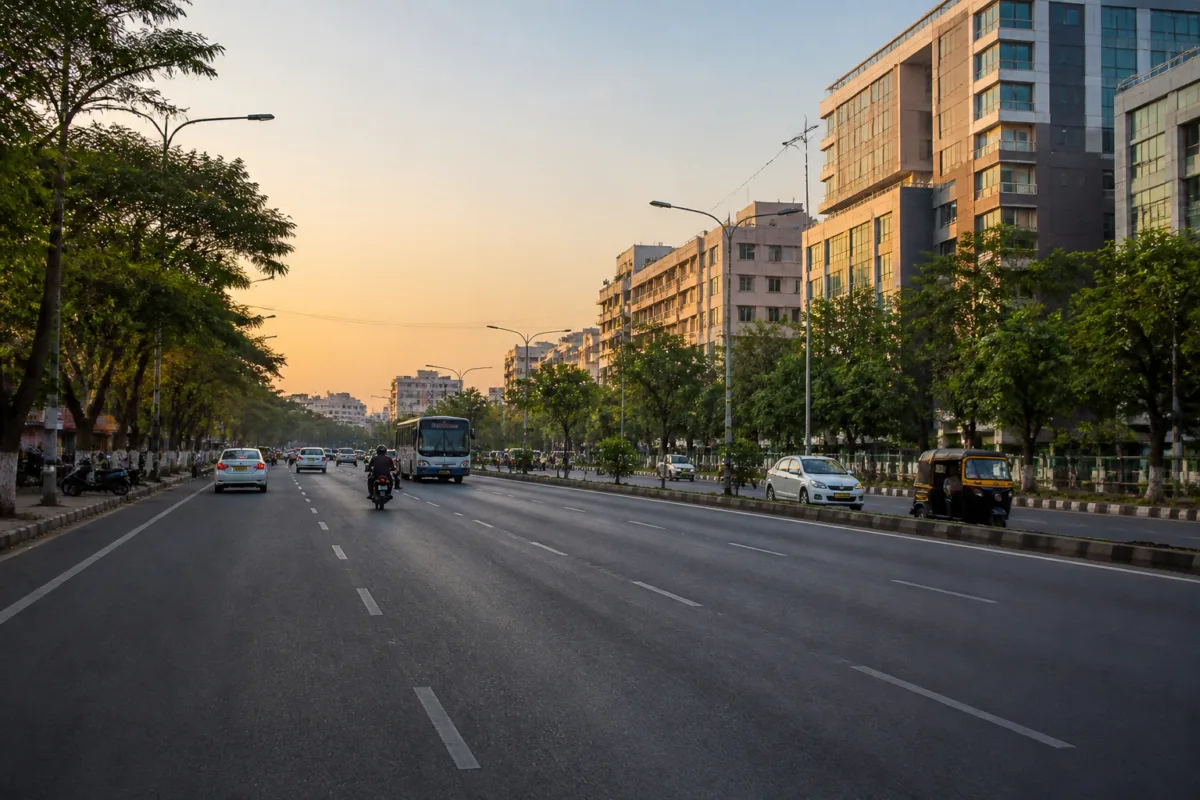
Pune traffic fell sharply across all 16 major roads during the Diwali holidays, but the more significant signal in the available data is that vehicle movement remained below pre-festival levels even after the celebrations ended. The pattern offers a short, clearly defined view of how school holidays, workplace attendance and travel outside the city can alter movement across Pune’s road network.
According to traffic data reported by Punekar News, average vehicle movement across the 16 roads declined by 37.79% during Diwali compared with the pre-festival period. The comparison covered three-day windows: October 30 to November 1 before Diwali, November 6 to 8 during the festival and November 13 to 15 after it. The figures were calculated using the average daily traffic recorded during each period.
The post-Diwali numbers are important because they show that the change was not limited to the holiday period itself. Vehicle movement during November 13 to 15 remained 19.01% below the pre-Diwali level across the roads covered in the analysis. All 16 roads recorded lower volumes in the post-festival period than before Diwali, although the scale of the decline varied by corridor.
Jungli Maharaj Road recorded the steepest fall during Diwali, at 43.80%. Fergusson College Road followed with a decline of 43.63%, while Shastri Road fell 43.37%, Tilak Road 43.10% and Sinhagad Road 42.63%. At the other end of the range, the University to Chandani Chowk stretch recorded the lowest decline, at 26.87%.
The spread across roads indicates that the festival affected corridors differently rather than producing a uniform reduction in movement. Nagar Road recorded a 28.27% decline during Diwali, while Karve Road registered a fall of 32.36%. The reported figures do not establish whether the differences were caused by land-use patterns, employment concentrations, travel behaviour or corridor-specific factors. They do, however, show that the effect was visible across roads serving different parts of the city.
The post-Diwali comparison provides a second layer to the data. Jungli Maharaj Road again recorded the largest decline, with traffic 24.25% below its pre-festival level. Tilak Road was down 20.75%, Airport Road 20.71%, Paud Road 20.33% and Senapati Bapat Road 19.88%.
Other major corridors also remained below their pre-Diwali volumes. Fergusson College Road recorded an 19.15% decline, Shastri Road 18.74%, Nagar Road 17.89%, Sinhagad Road 17.25% and Karve Road 16.87%. The data therefore point to a citywide pattern within the roads included in the analysis, rather than an isolated change on one or two streets.
The reported explanation for the fall during Diwali was straightforward: people travelled out of Pune, schools and colleges were closed and workplace attendance was lower. These factors reduce the number of routine journeys, including education trips, commuting and some work-related travel. The source attributes the post-festival decline to the fact that traffic volumes had not yet returned to their usual levels, but the available report does not identify the exact reason for that continued reduction.
That distinction matters when reading short-term traffic data. A road can appear less congested not because its capacity has increased or travel demand has permanently changed, but because fewer people are making regular trips during a particular period. In this case, the three observation windows allow the Diwali effect to be separated from the pre-festival baseline and from the first reported post-festival period. They do not, by themselves, establish whether the lower movement continued beyond November 15.
The analysis also illustrates the limits of interpreting road traffic through a single aggregate number. The overall Diwali decline of 37.79% is a useful citywide summary for the 16 selected roads, but the corridor-level figures range from 26.87% to 43.80%. The post-festival numbers similarly vary, with the reported decline reaching 24.25% on Jungli Maharaj Road and 16.87% on Karve Road among the corridors specifically listed.
This variation is relevant to urban administration because transport networks are experienced corridor by corridor. A citywide average can conceal different levels of dependence on schools, offices, commercial areas, residential neighbourhoods and intercity travel routes. The supplied data do not map those relationships, but they show why movement trends need to be read alongside the characteristics of individual roads.
The figures also provide a limited view of the relationship between mobility and the urban calendar. Pune’s road demand is not constant: it changes when schools and colleges close, offices operate with reduced attendance and residents leave the city. During these periods, the same road infrastructure carries fewer vehicles. The data do not measure travel time, congestion, emissions, public transport use or pedestrian movement, so they cannot show whether the traffic decline translated into broader improvements in urban mobility.
Institutionally, the report identifies traffic data as the basis for the comparison but does not name the agency that collected it or describe the measurement method for each road. It also does not state whether the figures represent all vehicle categories, whether the same counting points were used in each period or whether weather, road works or other temporary conditions affected the results. Those details would be necessary before using the numbers to evaluate transport policy or long-term traffic trends.
For now, the strongest conclusion is narrower. Diwali produced a substantial reduction in vehicle movement on all 16 roads covered, and traffic remained below the pre-festival level during the three-day post-festival observation period. The pattern was strongest on Jungli Maharaj Road and weakest on the University to Chandani Chowk stretch during the festival comparison, while Jungli Maharaj Road again recorded the largest post-festival gap.
The next question is whether the lower post-Diwali volumes were temporary or part of a longer change in travel behaviour. The supplied report does not provide observations beyond November 15, so it cannot answer that question. Further data would need to track the same corridors after the holiday period and clarify the collection method before the result could be treated as evidence of a sustained mobility shift rather than a short-term festival effect.