


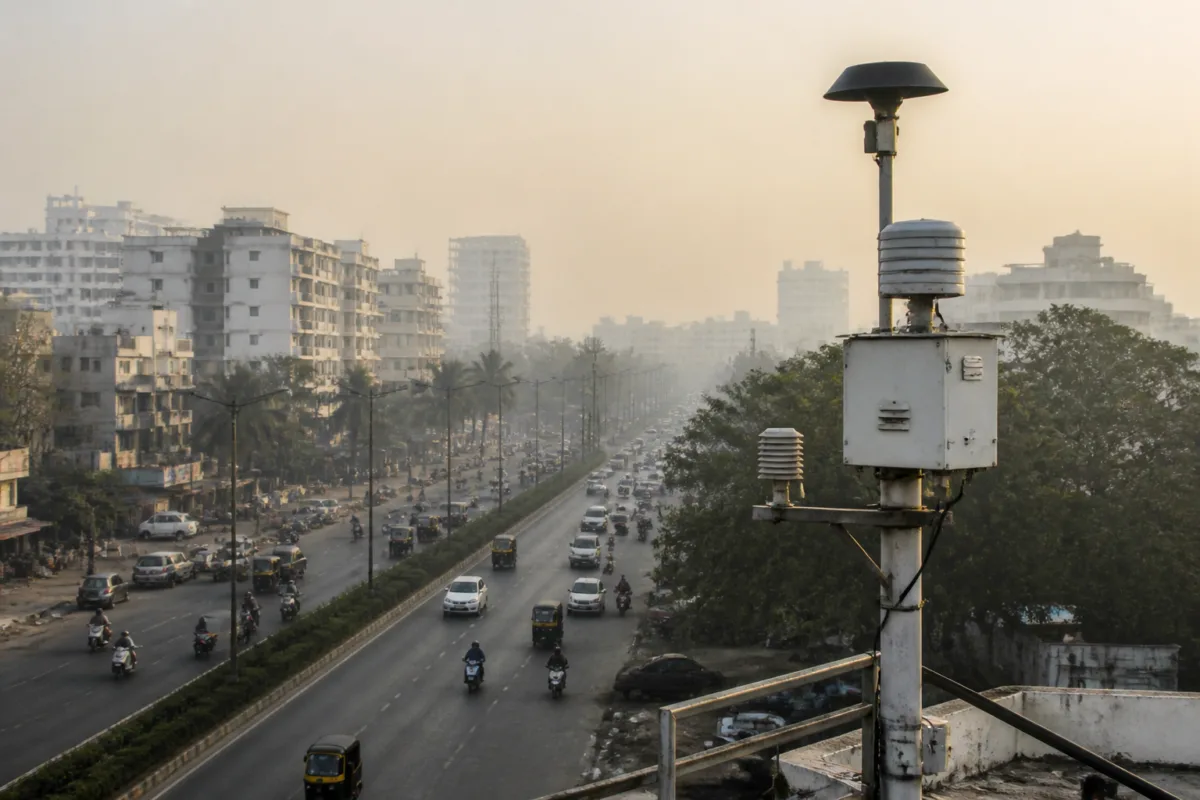
Pune’s air quality improved steadily in the days after Diwali, but the recovery was uneven across the city. Central and suburban monitoring locations recorded lower pollution levels between 2 and 5 November, while Furusungi continued to remain at a dangerous level, according to readings cited from the Central Pollution Control Board.
The city’s average Air Quality Index fell from 292 on Monday, 2 November, to 188 on Tuesday and 183 on Wednesday. By Thursday, the average had improved further to 158. The movement from the 201–300 range to the 101–200 range indicates that the most severe phase of the post-Diwali spike had eased, although the air was still not within the level considered safe for everyone.
That distinction is important because an improving citywide average does not mean that exposure risk has disappeared. CPCB-linked readings cited in the report showed an AQI of 178 at MHADA Colony, 188 at Shivajinagar Revenue Colony and 120 at Pashan. Furusungi, however, was still reported to be at a dangerous level, without a numerical reading being provided in the source material.
The pattern shows how a citywide AQI can conceal sharp differences between neighbourhoods. Pune’s air is measured through monitoring locations that capture local conditions, but residents experience pollution at street level, close to roads, construction activity, industrial areas, waste-burning sites and residential clusters. A lower average can therefore coexist with pockets where pollution remains substantially worse.
## What the Pune AQI readings reveal
The immediate cause of the deterioration was the large-scale use of fireworks around Lakshmi Puja, according to the report. Fireworks released smoke and pollutants into the air across central Pune and its suburbs. The resulting rise was reflected in the city’s average AQI of 292 on 2 November, a level classified as “poor” under the categories described in the report and close to the “very poor” threshold.
The subsequent decline over three days indicates that the pollution episode was at least partly temporary. The average fell by 104 points between 2 and 5 November. However, the source does not establish that fireworks were the only factor influencing the readings, nor does it provide pollutant-specific data for particulate matter or other contaminants. The available evidence supports a clear post-Diwali improvement, but it does not explain the precise contribution of each source or how quickly individual pollutants dispersed.
The report also identifies a seasonal background to the episode. Air quality is generally better during the rainy period, while dust levels rise after the monsoon ends. This creates a less favourable baseline before the additional pollution associated with fireworks. In a city where dry conditions and dust are already part of the post-monsoon environment, a short-duration emissions spike can push monitoring locations into much higher AQI categories.
The readings also underline why pollution management cannot be limited to festival-period advisories. The report places 0–50 in the safe range and 51–100 in the satisfactory range, while readings between 101 and 200 are described as capable of causing respiratory discomfort, particularly for children and senior citizens. A reading of 158 therefore represents improvement from the earlier peak, but not a return to clean air.
## Why neighbourhood-level variation matters
The difference between Pashan’s reading of 120 and Shivajinagar Revenue Colony’s 188 is significant within the same urban region. Both fall within the 101–200 band cited in the report, but the readings point to different local exposure conditions. MHADA Colony recorded 178, also indicating that the reduction in pollution was not uniform across the monitoring network.
Furusungi’s continued dangerous condition adds another layer to the picture. Because the source does not provide a numerical value or identify the specific cause of the location’s elevated pollution, the report cannot establish whether the reading was driven mainly by fireworks, dust, traffic, industrial activity or a combination of factors. What it does show is that citywide recovery was incomplete and spatially uneven.
This matters for residents because health risk is not experienced as an abstract city average. People spend time near homes, schools, workplaces, traffic corridors and local commercial areas. Children, elderly residents and people with existing illnesses are identified in the report as particularly vulnerable to poor air. The health impact can therefore remain concentrated in neighbourhoods even after the citywide average begins to fall.
The available data also has limits. The source provides daily average AQI values and readings from selected locations, but it does not include hourly trends, pollutant concentrations, weather conditions or a comparison with the same period in earlier years. It also does not state the number of monitoring stations contributing to the city average. Those gaps make it impossible to determine from the supplied evidence whether the improvement was caused mainly by the dispersal of fireworks smoke, changes in wind or rainfall, lower local emissions, or a combination of factors.
## The governance challenge after the pollution spike
The institutional responsibility is divided. The CPCB provides monitoring data and AQI classifications, while local authorities are responsible for responding to conditions on the ground through enforcement, dust control, traffic management, construction regulation and public communication. The report, however, does not record any specific municipal enforcement action, emergency measure or post-Diwali response by Pune authorities.
That absence is relevant because monitoring and action are different parts of air-quality governance. A reading tells residents what the air condition was at a particular location and time. It does not by itself identify the source of pollution or specify what should happen next. For authorities, the operational question is whether a dangerous reading should trigger inspections, stronger dust-control measures, restrictions on open burning, traffic interventions or targeted health advisories.
The uneven readings make a uniform citywide response difficult. If the average improves but a particular suburb remains in a dangerous category, a general announcement that the city’s air is getting better may not adequately inform residents in that locality. Local monitoring, timely publication of station-level data and clear responsibility for corrective action become important in such situations.
The report’s account also places festival pollution within a wider urban cycle. Rain can temporarily improve air quality, while the end of the monsoon brings a rise in airborne dust. Fireworks then add a short-term emissions shock. These factors operate alongside the everyday sources that the supplied material does not quantify. The evidence therefore points to a layered problem rather than a single isolated event: seasonal conditions create vulnerability, a festival peak worsens the readings, and recovery varies by location.
## What Pune’s recovery does and does not confirm
The numerical trend is clear. Pune’s average AQI improved from 292 on 2 November to 158 on 5 November, while readings at several locations also declined into the 101–200 range. This confirms that the severe post-Diwali episode had eased in the period covered by the report. It does not confirm that all neighbourhoods had returned to satisfactory or safe air, since Furusungi was still reported to be at a dangerous level and no citywide station-by-station recovery profile is provided.
The episode also demonstrates why AQI communication needs both a headline number and local detail. A citywide average is useful for tracking the broad direction of air quality, but it can obscure the conditions faced by residents in specific areas. The difference between improvement and safety must also remain explicit: an AQI of 158 is better than 292, but it remains within a range associated with respiratory discomfort for vulnerable groups under the classifications cited in the report.
The next useful evidence would be continued CPCB readings from the affected locations, including a numerical value for Furusungi, together with pollutant-specific data and information about the measures taken by local authorities. Until then, the supplied figures support a cautious conclusion: Pune’s post-Diwali air pollution declined significantly over several days, but the city had not recovered uniformly and some residents continued to face hazardous conditions.