


Extreme weather in India is no longer being recorded only as a series of isolated disasters. A report by the Centre for Science and Environment and Down To Earth, titled Climate India 2026, says that between January and September, 251 of 273 days—or 92 per cent of the period—saw extreme weather events somewhere in the country. The reported toll was 3,320 deaths, 42.5 lakh hectares of affected cropland, 1,28,334 destroyed houses and 47,244 dead animals.
The figures bring together events that are often administered separately: heat, heavy rain, floods, landslides and other weather extremes. Their combined effect is important for the built environment because the damage is not limited to farms or disaster sites. It reaches homes, roads, drainage systems, public health services and the ability of households to recover after an event. The report’s central signal is therefore not simply that extreme weather is becoming more frequent, but that the consequences are spreading across multiple systems at the same time.
The geographic pattern also shows why a national climate assessment cannot be reduced to a single city or hazard. Uttar Pradesh and Himachal Pradesh were identified as the most affected states in terms of the frequency of extreme weather events, with such events occurring on about 64 per cent of days during the first nine months of the year. Uttar Pradesh recorded the highest number of deaths at 811, followed by Maharashtra at 286 and Bihar at 245.
The damage to agricultural land adds another layer to the urban question. The report says that 42.5 lakh hectares of cropland had been affected by September. Maharashtra accounted for 28.3 lakh hectares, followed by Uttar Pradesh with 6.9 lakh hectares and Bihar with 2.3 lakh hectares. These losses are recorded outside city boundaries in many cases, but their consequences can travel through food supply, household incomes, migration and demand for public support. Climate risk is therefore linked to both rural production and urban consumption.
The five-year comparison is more concerning than the data for 2026 alone. According to the report, extreme weather events killed 16,303 people between 2022 and 2026, with nearly 65 per cent of those deaths occurring from 2024 to 2026. The affected cropland over the period reached at least 2.06 crore hectares. The annual comparison cited in the report shows that affected cropland rose from 18.4 lakh hectares in 2022 to 94.7 lakh hectares in 2025, while 42.5 lakh hectares had already been affected by September 2026.
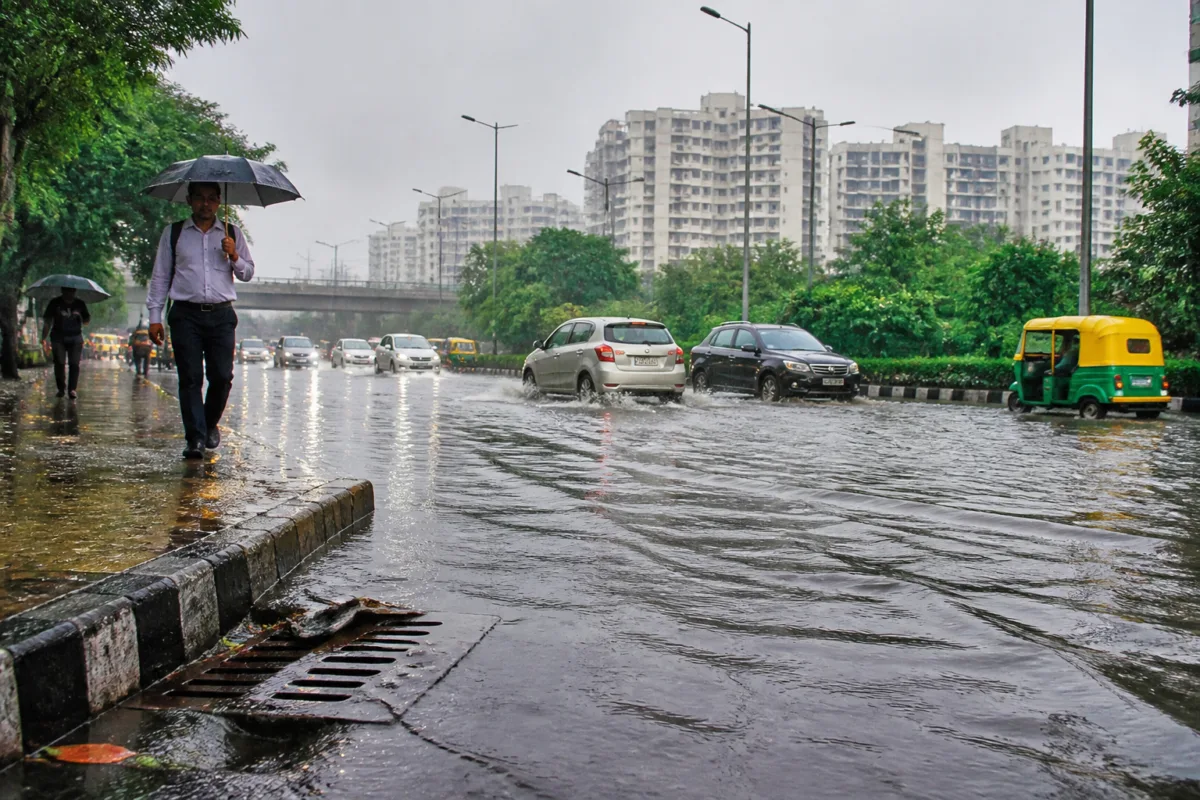
For cities, Delhi provides a concentrated illustration of how different climate pressures can appear within the same administrative region. During a heat episode in May, the maximum temperature at the Ridge reached 44.6 degrees Celsius. The supplied report also records heavy rain in October: in the 24 hours ending at 8.30 am on October 12, Safdarjung recorded 41.6 millimetres, described as the highest October daily figure there in four years. The Ridge recorded 49 millimetres, while waterlogging was reported in areas including Sainik Farms and Mahipalpur.
These observations point to two distinct but connected infrastructure challenges. Heat places pressure on the thermal comfort and safety of people who work, travel or live in exposed environments. Intense rain tests the capacity of drains, roads, underpasses and local pumping arrangements. When both risks occur in the same city over a year, resilience cannot be treated as a single drainage or flood-control project. It involves how streets, buildings, public facilities and emergency systems are designed and maintained.
The Delhi examples also show the difference between rainfall totals and urban impact. The report says the monsoon received 13 per cent less rain than normal, yet every one of the monsoon’s 122 days saw heavy rain, flooding or landslides somewhere in the country. A lower seasonal total, therefore, did not prevent disruptive events. For urban authorities, this distinction matters because drainage stress can be produced by the timing, intensity and location of rainfall, not only by the total seasonal accumulation.
The report’s climate indicators extend beyond flooding. It says winters are becoming warmer and cold-wave events are declining. February 2026 was the first February in five years in which no cold-wave or cold-day event was recorded, and it was also the fourth-warmest February in 125 years. These findings, as presented in the report, describe a changing range of risks rather than a simple increase in one type of disaster.
That change complicates the division of responsibilities across public institutions. Heat response, drainage, flood management, housing safety, agriculture and disaster relief are generally handled through different departments and levels of government. Yet the reported damage cuts across those boundaries. A destroyed house may require municipal action, revenue assessment and relief administration. A flooded road may involve drainage agencies, traffic authorities and local governments. Crop losses may require a different set of state and national responses. The figures make the institutional fragmentation visible even though the report does not prescribe a single administrative model.
The built environment is also central to how losses are distributed. The report records more than 1.28 lakh houses destroyed nationally during the first nine months. That number is a direct reminder that climate exposure is partly a question of construction quality, settlement location and access to protective infrastructure. However, the supplied material does not break down the housing damage by building type, tenure, income group or municipal area. Those details would be necessary to establish which residents face the greatest exposure and whether existing building regulations or settlement planning are reducing risk.
The same limitation applies to the Delhi data. The report identifies heat at the Ridge, rainfall readings at Safdarjung and the Ridge, and waterlogging in specific locations, but it does not provide a detailed assessment of drainage capacity, maintenance budgets, land-use change or the duration of disruption. The available evidence can establish that the city experienced heat and intense rain, and that waterlogging occurred in several areas. It cannot, by itself, establish which infrastructure failure caused each location’s flooding.
What the evidence does establish is a growing scale of exposure across time, geography and sectors. The recent three-year concentration of deaths, the rise in affected cropland between 2022 and 2025, the high number of weather-affected days in 2026 and the simultaneous recording of heat and heavy rain all challenge the idea that climate events are exceptional interruptions to normal urban planning. They are becoming recurring conditions against which infrastructure and public administration must operate.
The immediate policy question is consequently not only how authorities respond after a disaster. It is also whether urban systems are being planned around the full range of hazards identified in the evidence. The report does not provide a city-by-city audit of preparedness, nor does it quantify the performance of individual drainage, housing or emergency-response programmes. Those gaps remain important. For now, the confirmed pattern is clear: extreme weather is producing repeated losses in lives, homes, cropland and animals, while cities such as Delhi are experiencing both severe heat and rainfall-related stress. The next developments to monitor are the official responses to these losses and whether climate-risk data is incorporated into everyday infrastructure and land-use decisions.