


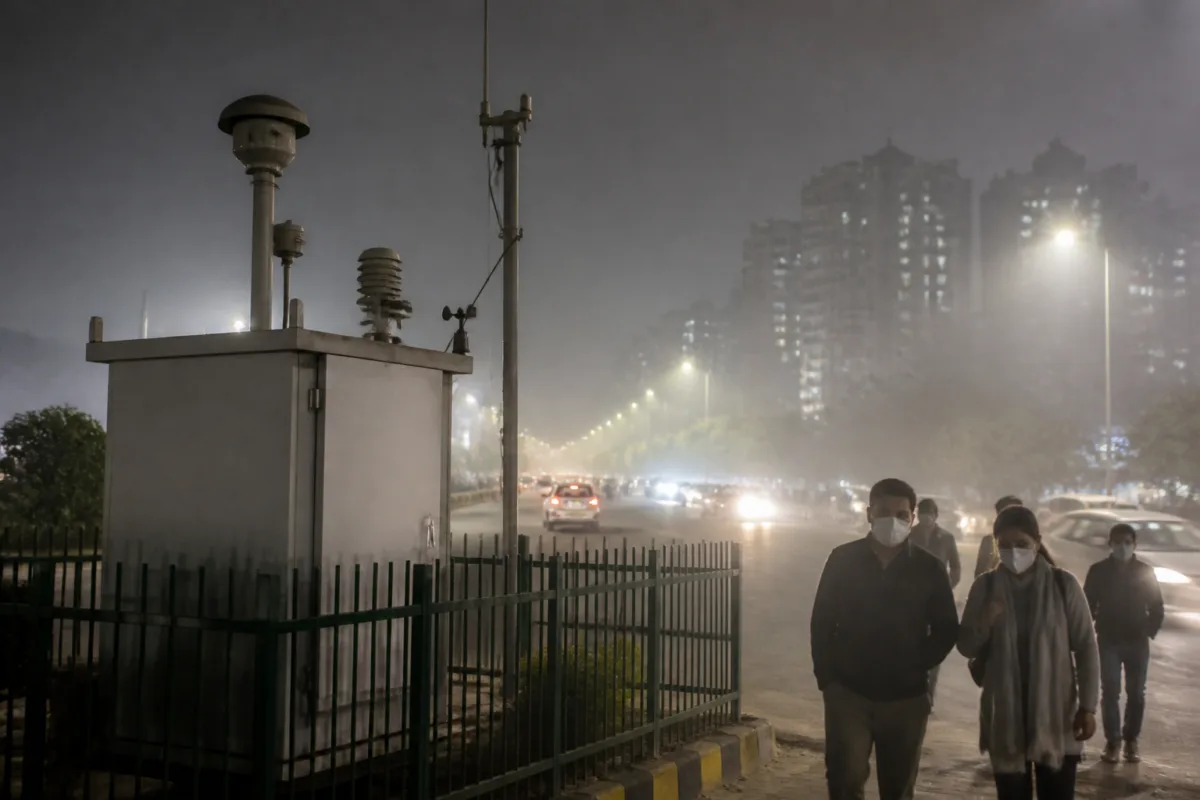
Delhi’s Diwali pollution exposed a critical weakness in the way extreme air quality is communicated: the monitoring equipment can record particulate concentrations far above the level represented by an AQI of 500, but India’s national AQI calculation does not move beyond that ceiling. The result is that the public may see a maximum-category number even as the underlying concentration continues to rise sharply.
At the R.K. Puram monitoring station, PM2.5 concentration reached 504 micrograms per cubic metre at 8 pm on Diwali night and rose to 924 micrograms per cubic metre at 9 pm, according to the report by Jagran. Data from that station then stopped appearing. Several other monitoring locations, including Nehru Nagar, Dwarka, Jawaharlal Nehru University and Mundka, also showed gaps lasting several hours.
The immediate question is not whether an AQI of 500 already represents a severe health emergency. It does. The more important institutional question is what happens to information once pollution exceeds the upper limit of the public index. A capped index can communicate that conditions are extremely dangerous, but it cannot show whether the concentration is marginally above the cap or several times higher. That distinction matters for health warnings, scientific assessment, enforcement and public understanding.
The report separates two systems that are often treated as if they were the same: the measurement of pollutants and the calculation of the AQI. Monitoring instruments measure the concentration of pollutants such as PM2.5 and PM10. The AQI then converts pollutant concentrations into an index based on a defined formula. According to the report, the beta attenuation monitors used in Central Pollution Control Board stations are not limited to measuring concentrations corresponding to an AQI of 500. Their measurement capacity can extend to 1,000 micrograms per cubic metre or more.
The limit of 500 therefore belongs to the national AQI formula, not necessarily to the instrument measuring the air. Once the calculated index reaches 500, the public-facing number cannot distinguish between substantially different pollution concentrations above that point. In practical terms, the same AQI display may cover a wide range of exposure conditions.
That distinction became visible in the readings cited in the report. Sirifort recorded a maximum PM2.5 concentration of 1,000 micrograms per cubic metre by noon, described as the highest value displayed so far on the CPCB’s public portal. Punjabi Bagh recorded 993, while concentrations of 989 were recorded at Terminal 3 of Indira Gandhi International Airport and Chhawla. IMD Lodhi Road recorded 987, followed by Shadipur at 967, ITO at 966, CRRI Mathura Road at 965, Aya Nagar at 961 and Lodhi Road at 958.
These figures are pollutant concentrations, not directly comparable AQI values. The report also notes that international monitoring platforms such as IQAir may show figures between 1,000 and 1,500 using different calculation methods and scales. Those numbers cannot be compared directly with the CPCB’s AQI without accounting for the different formulas. The broader point, however, remains clear: different systems can present the same polluted atmosphere through very different numbers.
This creates a communication problem for a city that relies heavily on real-time air-quality information. Residents use monitoring portals to decide whether to travel, exercise outdoors, send children outside or take precautions for vulnerable family members. If the index reaches 500 and remains there while pollutant concentrations continue to increase, the headline indicator stops conveying the scale of deterioration. It communicates severity, but not intensity beyond the ceiling.
The missing data from several stations adds a second layer to the problem. The report raises three possible explanations: a technical issue with the instruments, a problem in processing the data, or the possibility that pollutant readings were recorded but were not publicly displayed because the AQI had already reached its maximum. The supplied report does not establish which explanation applies. That uncertainty is itself significant because public monitoring systems derive credibility not only from the numbers they publish but also from explaining gaps in those numbers.
Dr Anil Gupta, a CPCB member, is quoted as saying that an AQI of 500 is already extremely serious from a health perspective and that the national standards prescribe a maximum display value of 500. He also said that temporary failures at some stations would not affect the AQI calculation because the index is based on a 24-hour average. This explains the administrative logic of the current system, but it does not resolve the separate question of whether the underlying concentration data should remain visible when the index reaches its ceiling.
Delhi has 59 air-quality monitoring stations, the report states, making it the city with the highest number of such stations in the country. A dense network can improve spatial coverage, but it does not automatically solve the problem of how extreme readings are represented. Monitoring capacity, data processing, index design and public communication are different parts of the same information chain. A weakness in any one of them can limit what residents and institutions understand about the emergency.
The AQI’s ceiling also has implications for governance. A capped number may simplify public communication and keep the index aligned with nationally defined categories. But during extreme pollution episodes, the same simplicity can remove useful distinctions. Authorities may know that concentrations are rising beyond the maximum category, while citizens see a number that appears unchanged. Without publishing the underlying pollutant concentrations alongside the capped AQI, the public cannot easily tell whether the situation is stable at the maximum level or worsening further.
The issue is not limited to Diwali. The report focuses on the festival night because the highest readings and data gaps appeared during a period of intense pollution. However, the structural question applies to every episode in which pollutant concentrations exceed the range represented by the index. A system designed for ordinary categorisation can become less informative during the very conditions when accurate and transparent information is most needed.
There is also a distinction between measuring pollution and assigning responsibility for it. The reported readings establish the scale of particulate concentration at specific monitoring locations. They do not, by themselves, identify the contribution of fireworks, traffic, construction dust, regional transport or weather conditions. Nor do they establish why individual stations stopped showing data. Those questions require separate evidence. Keeping those limits clear is essential when the numbers are used in public debate.
The immediate institutional task is therefore clarification. The CPCB needs to explain whether the R.K. Puram and other station readings were captured continuously, why public data stopped appearing after certain periods, and how concentrations above the AQI ceiling are handled on its portal. It also needs to make clear how the 24-hour average is calculated when short-duration peaks are exceptionally high. These are questions about the functioning of a public information system, not merely about the design of a single index.
What the Diwali episode confirms is that Delhi’s air-quality problem is larger than the number displayed on a dashboard. The reported concentrations show that monitoring instruments can capture extreme particulate levels, while the national AQI can compress those conditions into a maximum value of 500. What remains unclear is whether data gaps were caused by equipment, processing or publication practices. That distinction should be resolved before the next severe pollution episode, because a city cannot manage an environmental emergency effectively if its public indicators stop becoming more informative at the point of greatest risk.