


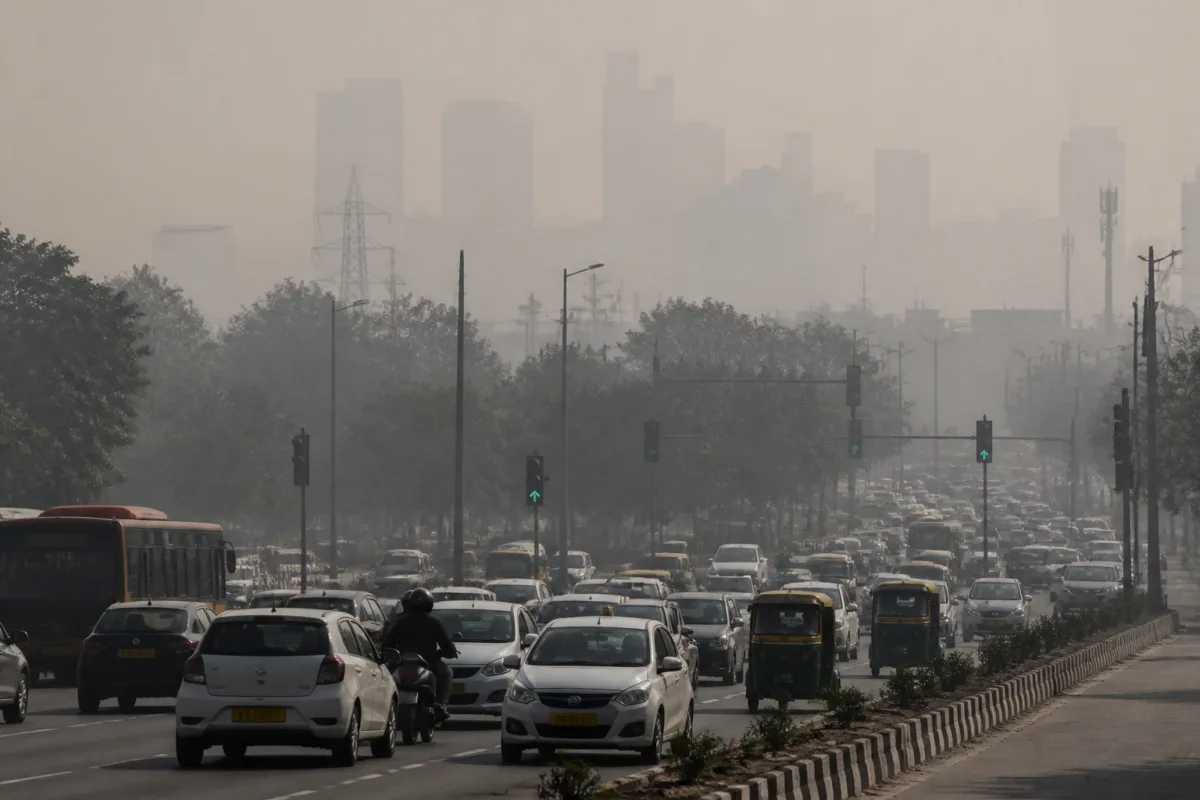
Delhi AQI is entering the post-Diwali period with a severe warning already visible in the data: the three days before this year’s festival recorded an average reading of 373, the highest pre-Diwali level in a decade. Historical readings since 2015 show that the four days after Diwali have produced an average AQI 16% worse than the four days before it, while the number of severe-air days has tripled.
The pattern is not simply about one night of firecracker emissions. It is the result of a recurring collision between festive pollution, heavy traffic, falling temperatures, weak winds and atmospheric stagnation. In north India, these late-autumn conditions can trap pollutants close to the ground, allowing emissions released during Diwali to build on an already deteriorating baseline.
That distinction matters for understanding what the AQI data is showing. Delhi’s post-Diwali pollution is often discussed as an episodic festival problem, but the figures indicate a broader seasonal and urban-system failure. Pollution levels are already elevated before the festival because of increased traffic and congestion. Firecracker emissions then arrive when the atmosphere is less capable of dispersing pollutants, producing a sharp increase in exposure over the following days.
The historical record in the supplied analysis reinforces the consistency of this cycle. In 10 of the 11 years since air-quality monitoring began in Delhi, post-Diwali AQI readings were higher than pre-Diwali levels. In eight of those years, the increase exceeded 10%, and in four years it was above 30%. Across the four-day periods studied since 2015, Delhi recorded 15 severe-air days after Diwali, compared with five in the four days preceding the festival.
The strongest increases occurred in years when the pre-festival baseline was already high. In 2023, the average AQI rose from 289 in the four days before Diwali to 393 in the four days after it, an increase of more than 36%. The AQI on the day after the festival was 64% higher than on Diwali itself. In 2021, the average rose from 320 to 429, a 34% increase. Post-Diwali pollution was also 33% higher in 2018 and 31% higher in 2019.
These comparisons show why a single festival-day reading can be a poor measure of the episode. The worst recorded conditions may occur after the event, when pollutants from the night combine with emissions from normal traffic and unfavourable weather. A city that evaluates the problem only through the Diwali-day average risks missing the period when residents may face the most intense exposure.
The data also contains an important exception. In 2020, the average AQI fell by 26% over the four days after Diwali. That decline, however, did not mean that the festival produced a mild pollution episode. The AQI reached 435, in the severe category, on the day after Diwali, compared with 414 on the festival day. Rainfall across several parts of the region subsequently brought readings down to 221, 171 and 211 over the next three days.
This exception demonstrates how strongly weather can influence the recorded outcome. Rain can remove or suppress pollutants in the atmosphere, while low wind speeds and stagnant conditions can retain them near the surface. The contrast between the severe reading immediately after Diwali and the lower readings that followed rainfall suggests that the festival’s emissions cannot be assessed separately from atmospheric conditions.
The most recent data raises a more difficult concern. The average AQI of 373 during the three days before this year’s Diwali is the highest pre-festival reading in a decade. A high starting point does not establish exactly how much pollution will follow, but it leaves less room for deterioration before the air enters the severe range. The historical pattern therefore makes the coming post-festival period a high-risk monitoring window rather than a routine seasonal fluctuation.
There is also an institutional issue in how the pollution episode is captured. Under the Central Pollution Control Board’s system, the 24-hour average up to 4pm is used as the AQI for the day. Pollution from Diwali night and the following morning is consequently reflected in the next day’s reading. This means that the public-facing number depends not only on when pollution occurs, but also on the period included in the daily calculation.
Last year’s readings illustrated another measurement problem. The Times of India reported that a majority of Delhi’s air-quality monitoring stations stopped transmitting data during peak pollution hours on Diwali night, when the AQI had reached 500. The interruption lowered the average recorded for the following day, according to the report. If monitoring stations do not transmit during the most polluted hours, the resulting average may fail to represent the conditions experienced by residents at street level.
That limitation does not make the AQI system irrelevant, but it makes continuity and completeness of monitoring central to interpreting the numbers. A daily average is only as representative as the data collected across the relevant period and locations. In a city where pollution can change sharply over several hours, gaps during the peak episode can materially affect how the event is recorded and understood.
The evidence points to three linked urban responsibilities. The first is reducing the pre-festival pollution load created by traffic and congestion. The second is tracking the combined effect of firecracker emissions and weather during the days after Diwali, rather than concentrating attention only on the festival night. The third is ensuring that monitoring stations continue transmitting during peak pollution hours so that official readings reflect actual conditions.
None of these factors operates in isolation. Firecrackers may create a short, intense emissions pulse, but the severity of the resulting episode depends on the background pollution level and the atmosphere’s ability to disperse it. Traffic adds to the baseline, while low temperatures, weak winds and stagnation prevent pollutants from clearing. The city’s air-quality crisis is therefore both an emissions problem and a measurement and coordination problem.
The decade-long record confirms the direction of the risk: post-Diwali air has been worse than pre-Diwali air in nearly every year examined, and severe-air days have been more frequent after the festival. What remains to be established for this year is how the unusually high pre-Diwali baseline, actual festive emissions, weather conditions and the continuity of monitoring will combine. The most important developments to track are the AQI readings over the four days after Diwali, the number of severe-air days and whether monitoring data remains available during peak pollution hours.