


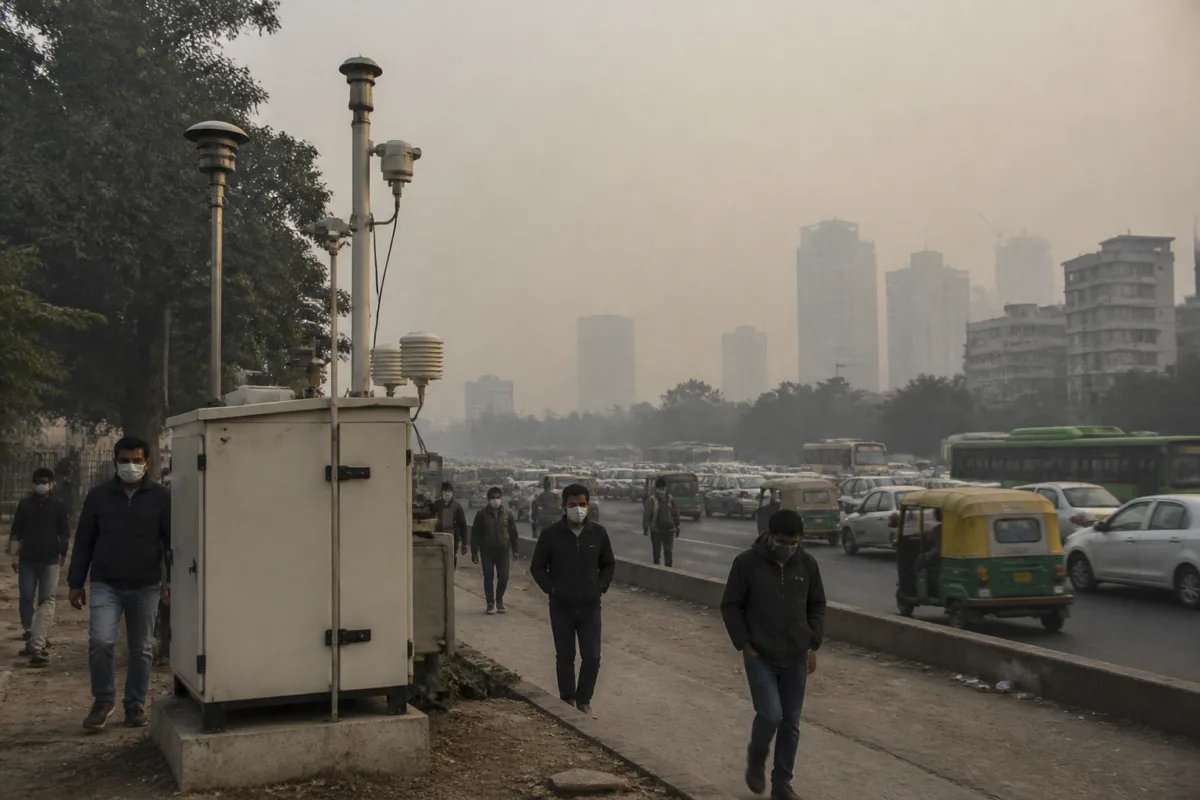
Delhi’s Diwali pollution readings exposed a problem deeper than the difference between an official AQI of 370 and private-platform readings approaching 1,000: the city did not have a complete, consistent account of the hours when pollution was at its peak. Monitoring stations went offline through the night, some readings were excluded from the city average, and different platforms applied different AQI scales.
The Central Pollution Control Board’s 24-hour average placed Delhi’s AQI at 370 on the Monday after Diwali, while another account cited a reading of 376 and an hourly reading of 371 at 10am. The report said this was the highest pollution level recorded on the day after Diwali in the past five years, although the 2021 Diwali-day AQI had reached 382. Several monitoring stations recorded levels above 400, categorised as severe.
At the same time, AQI.in reported a Delhi reading of 787 under Indian standards and close to 955 under US standards, according to reporting cited from The Indian Express. IQAir recorded 245 on the US scale at 8.30am, a level described as very unhealthy. AQI.in also reported that Delhi’s AQI rose to 2,283 after Diwali. These figures cannot be read as direct like-for-like comparisons because the platforms use different standards, pollutant thresholds and calculation methods.
The official Indian AQI scale has a ceiling of 500. That ceiling does not mean pollution stops increasing once the index reaches 500; it means the official index no longer expresses the additional concentration through a higher number. International platforms may continue to show readings above 500 because they use different pollutant breakpoints and scales. A single concentration of particulate matter can therefore produce different AQI values without the underlying pollution necessarily being different.
The more consequential gap emerged in the monitoring network itself. An analysis of CPCB data cited in the report found that PM2.5 levels at Siri Fort and ITO approached 1,000 micrograms per cubic metre. Those readings became available after the stations resumed operation following a period offline. The report said Delhi did not record a PM2.5 reading above 1,000 at any station this year, but the near-1,000 readings show how sharply pollution intensified at some locations.
The timeline of missing data indicates that the problem was concentrated during the hours when fireworks were being used most heavily. At 7pm on Sunday, one monitoring station was not providing data. By 10pm, the number had risen to seven; by 11pm, it was 23. At midnight, 29 stations were unavailable, and the number reached 36 at 1am. Thirty-five stations were still not reporting at 2am, followed by 30 at 3am, 20 at 4am, 19 at 5am and 16 at 6am.
The report identified Nehru Nagar and Pusa, operated by IITM, among seven stations with no PM2.5 data between 10pm and 6am. That period is important not simply because it is part of the daily cycle, but because it overlaps with the reported peak in firecracker use. When a monitoring system loses coverage during the most polluted hours, the resulting daily average may describe the available data more accurately than it describes the exposure experienced across the city.
The averaging rule adds another institutional layer. The report said a station requires 16 hours of readings for its data to be included in the average AQI. Stations that did not provide the required amount of information were removed from the city average. This rule may create consistency in how a formal average is calculated, but it also means that a station that stops reporting during a pollution spike can disappear from the calculation rather than contribute a high value to it.
That distinction is central to understanding the apparent contradiction between the official and private readings. The official AQI is not only a measurement of pollution concentration. It is also the output of a system involving station availability, minimum data requirements, pollutant averaging and a scale that ends at 500. Private platforms may use more available stations, different averaging windows or different pollutant-to-index conversions. Their higher readings do not automatically prove that the official number was fabricated, but they do show that the two figures answer different measurement questions.
The episode also shows why real-time public data is not a technical accessory. An AQI number supports decisions about outdoor activity, school operations, construction work, traffic management and emergency pollution response. If the network stops reporting during the critical hours, residents may receive an incomplete picture precisely when they need timely information. CSE executive director Anumita Roychowdhury was quoted as saying that the failure to provide real-time monitoring data was difficult to understand and that accurate advice and emergency steps depended on such data.
The responsibility for the official system is distributed across monitoring stations, operating agencies, CPCB processes and the authorities responsible for responding to pollution alerts. That makes the issue larger than a dispute between a government dashboard and private applications. The public needs to know which stations were operational, why they stopped transmitting, whether the outages were caused by equipment or communications failures, and how missing data affected the final average.
Delhi’s political response has so far focused on accountability for the offline stations. Cabinet minister Kapil Mishra said at a press conference that he would have the matter investigated and requested details of the stations that were not working. Opposition leader Saurabh Bhardwaj alleged that the Delhi government had manipulated AQI figures to understate pollution. That allegation remains a political claim in the supplied report and is not established by the monitoring data described.
What the evidence does establish is narrower and more important: the city had significant gaps in monitoring during the night of peak firecracker activity, several stations were excluded after failing to provide the required number of readings, and different AQI systems produced substantially different public numbers. These facts make it difficult for residents to interpret the official average without also seeing station-level concentrations and a complete record of missing data.
The next test is whether authorities publish a station-by-station account of the outages, explain the technical cause and show how the missing observations affected the reported average. Until that information is available, Delhi’s AQI figures should be read with attention not only to the number displayed, but also to the scale used, the stations included and the hours for which data is missing.