


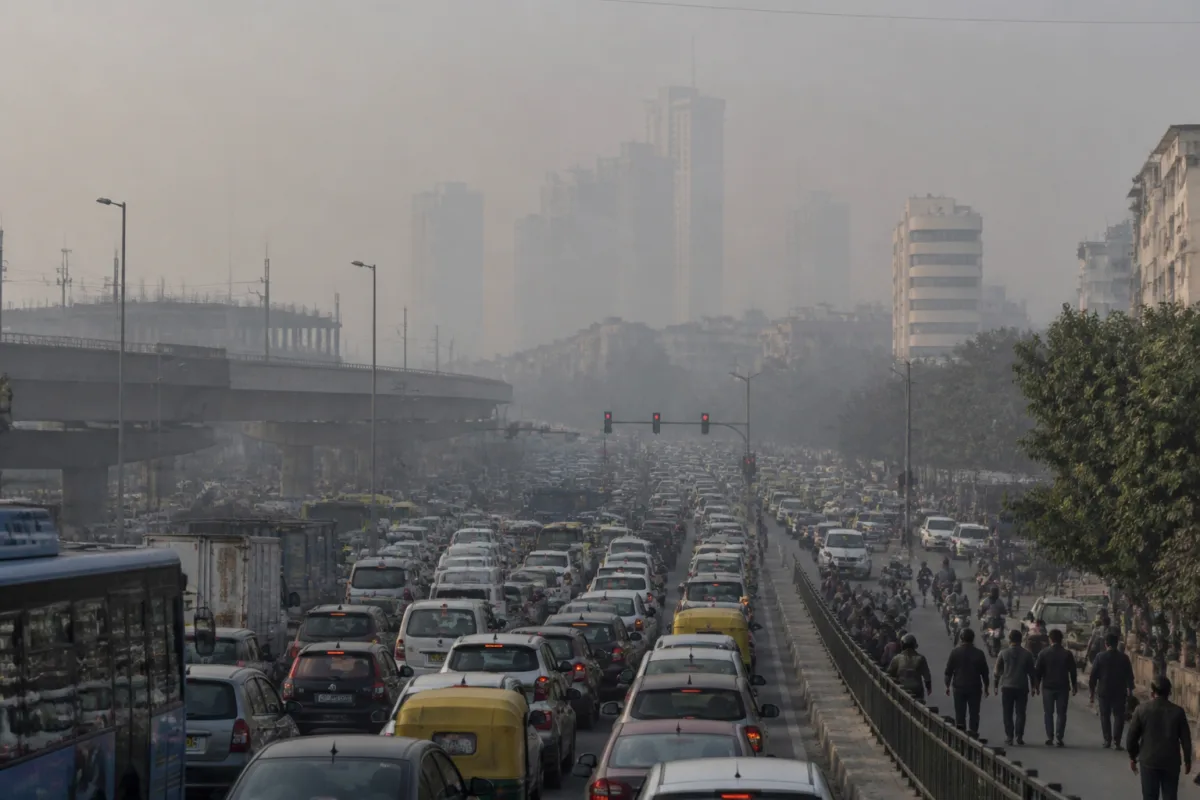
Delhi pollution hotspots are no longer confined to the areas that have dominated the city’s winter air-quality map for years. A Centre for Research on Energy and Clean Air (CREA) analysis cited by Jagran shows that ITO, Delhi Technological University, Pusa, Sonia Vihar and North Campus have entered the top 10 most polluted areas this winter, while several long-standing hotspots have fallen sharply in the ranking.
The shift matters because it changes the way Delhi’s air pollution must be understood. The city’s winter pollution burden is not distributed evenly, and the latest comparison suggests that local conditions such as traffic congestion, biomass burning, road dust and waste accumulation can significantly alter pollution levels from one neighbourhood to another. The evidence points towards a problem that is both city-wide and intensely local.
The CREA analysis compares PM2.5 levels across Delhi monitoring locations during October-February over the previous six winters. Data for the current 2026-27 winter season was available only until 13 November. Within that limited period, ITO ranked third among the most polluted areas, DTU fifth, and other new entrants also recorded marked increases in their relative positions.
That movement is not simply a change in a list. It indicates that pollution exposure is being shaped by changing activity patterns and local emissions, rather than by a fixed set of permanent hotspots. An area may remain part of the wider city-wide pollution system, but its position relative to other neighbourhoods can change considerably when traffic, dust or burning intensifies.
## The geography of Delhi’s changing pollution burden
ITO’s ranking provides the clearest example. It stood 17th in the 2021-22 winter, improved to 13th in 2022-23, and then fell to 24th and 26th in the following two winters. It ranked 18th last season before rising to third this winter. The CREA analysis links the latest increase to frequent traffic congestion around the area.
ITO is one of Delhi’s most important transport and administrative nodes. Its pollution profile therefore illustrates how mobility pressure can create a localised air-quality burden even when the area is not consistently among the city’s worst-ranked locations. Congestion increases the intensity and duration of vehicle activity in a constrained urban environment, making traffic management relevant not only to travel time but also to neighbourhood-level pollution exposure.
DTU shows a different but related pattern. The area ranked 13th in 2021-22, fell to 37th the following winter and remained between 27th and 39th for the next three seasons. This winter, it moved to fifth. The CREA analysis attributes the increase to biomass burning and dust, suggesting that the sources affecting the area are not limited to traffic.
Pusa, Sonia Vihar and North Campus also recorded notable increases in their rankings, with traffic congestion identified as a factor. These locations represent different urban settings, but their inclusion in the top 10 reinforces the point that Delhi’s pollution geography is broadening across distinct parts of the city.
Six areas had appeared among Delhi’s 10 most polluted locations during each of the previous five winters: Jahangirpuri, Rohini, Mundka, Wazirpur, Nehru Nagar and Anand Vihar. Yet only Jahangirpuri and Rohini remained in the top 10 this winter. Mundka moved to 13th, Wazirpur to 35th, Nehru Nagar to 38th and Anand Vihar to 48th. R K Puram returned to the top 10.
This does not mean that the older hotspots have ceased to experience pollution. It means that their relative position has changed in the period covered by the analysis. The distinction is important for policy because a decline in ranking does not automatically indicate that pollution has been eliminated or that exposure is no longer a concern.
## Why a city-wide problem needs local action
The analysis, as quoted by Jagran, identifies additional local emissions as an important factor in neighbourhoods that are already affected by Delhi’s broader pollution load. CREA’s Manoj Kumar said Delhi was already facing a serious pollution problem, but that some localities were carrying an additional burden from local emission sources.
That observation exposes a governance challenge. Air pollution is often treated as a single regional crisis, particularly during winter, when the city’s air quality deteriorates and the public debate turns towards broad emergency measures. But the ranking changes show that local authorities also need to identify what is happening at street and neighbourhood level.
The measures cited in the analysis are consequently specific rather than generic: controlling traffic congestion, enforcing a ban on waste burning, repairing broken roads and reducing accumulated waste at the Bhalswa landfill site. Each measure falls within a different administrative or operational responsibility. Traffic management involves transport and enforcement agencies; waste burning requires local monitoring and municipal action; road repairs depend on road-owning agencies; and landfill management involves municipal solid-waste systems.
The institutional challenge is that these sources do not sit neatly within one department. A pollution hotspot may be created by the interaction of road design, traffic demand, construction or road dust, waste practices and surrounding land uses. A response focused only on ambient air-quality alerts may therefore fail to address the specific activity generating the additional burden.
Delhi’s environment department had already identified 13 official pollution hotspots: Anand Vihar, Okhla, Mundka, Dwarka, Bawana, R K Puram, Rohini, Narela, Jahangirpuri, Vivek Vihar, Wazirpur, Ashok Vihar and Punjabi Bagh. These areas were identified using annual average thresholds of more than 300 micrograms per cubic metre for PM10 and more than 100 micrograms per cubic metre for PM2.5.
The existence of an official hotspot list and the appearance of new locations in the CREA winter ranking point to two different policy functions. The official list provides a basis for sustained intervention in areas with persistently high annual pollution. The seasonal comparison, meanwhile, can reveal where conditions are worsening or where short-term and localised pressures are emerging.
## PM2.5 and PM10 show different urban pressures
The CREA comparison also demonstrates why pollution cannot be understood through a single measure. The winter ranking discussed in the analysis focuses on PM2.5, while the PM10 data produces a different list of the most polluted locations.
For PM10, IIT Delhi recorded the highest average level at 326 micrograms per cubic metre. Jahangirpuri followed at 305, and Chandni Chowk ranked third at 299. The remaining locations in the 10-place list were Mundka at 292, Dwarka Sector 8 at 282, Punjabi Bagh at 273, Wazirpur at 270, Rohini at 268, CRRI Mathura Road at 267 and Delhi University’s North Campus at 263 micrograms per cubic metre.
The contrast between the PM2.5 and PM10 rankings is significant for urban management. It suggests that different locations may be experiencing different combinations of pollution sources. The analysis links some PM2.5 ranking changes to traffic congestion, biomass burning and dust, while the PM10 list includes locations with major roads, dense activity and other conditions associated with larger particulate matter.
The data supplied in the report does not establish a single cause for every location, and the rankings should not be treated as a complete source-apportionment exercise. However, the difference between the two lists shows why interventions need to be linked to the pollutant and the local activity involved. A strategy designed for traffic emissions may not address waste burning or road dust, just as a landfill intervention cannot by itself resolve congestion-related emissions.
## The bigger urban question
Delhi’s shifting pollution hotspots raise a broader question about how the city monitors and manages environmental risk. If a locality can move sharply up or down the seasonal ranking, pollution planning must be capable of responding to change without abandoning areas that have historically faced high exposure.
That requires a layered approach: long-term action in officially recognised hotspots, seasonal monitoring across the wider city and targeted enforcement where local conditions add to the regional pollution load. The CREA analysis supports the need for year-round measures, rather than interventions limited to the winter emergency period.
What the evidence confirms is that Delhi’s pollution burden is both persistent and mobile. Old hotspots remain part of the city’s environmental history, but new areas can rise quickly when congestion, dust, biomass burning or waste conditions intensify. What remains unclear from the supplied analysis is the precise contribution of each source at every location. The next policy test is whether Delhi’s agencies can connect monitoring data to specific local action, and whether the seasonal rankings are used to update interventions before pollution becomes entrenched.