


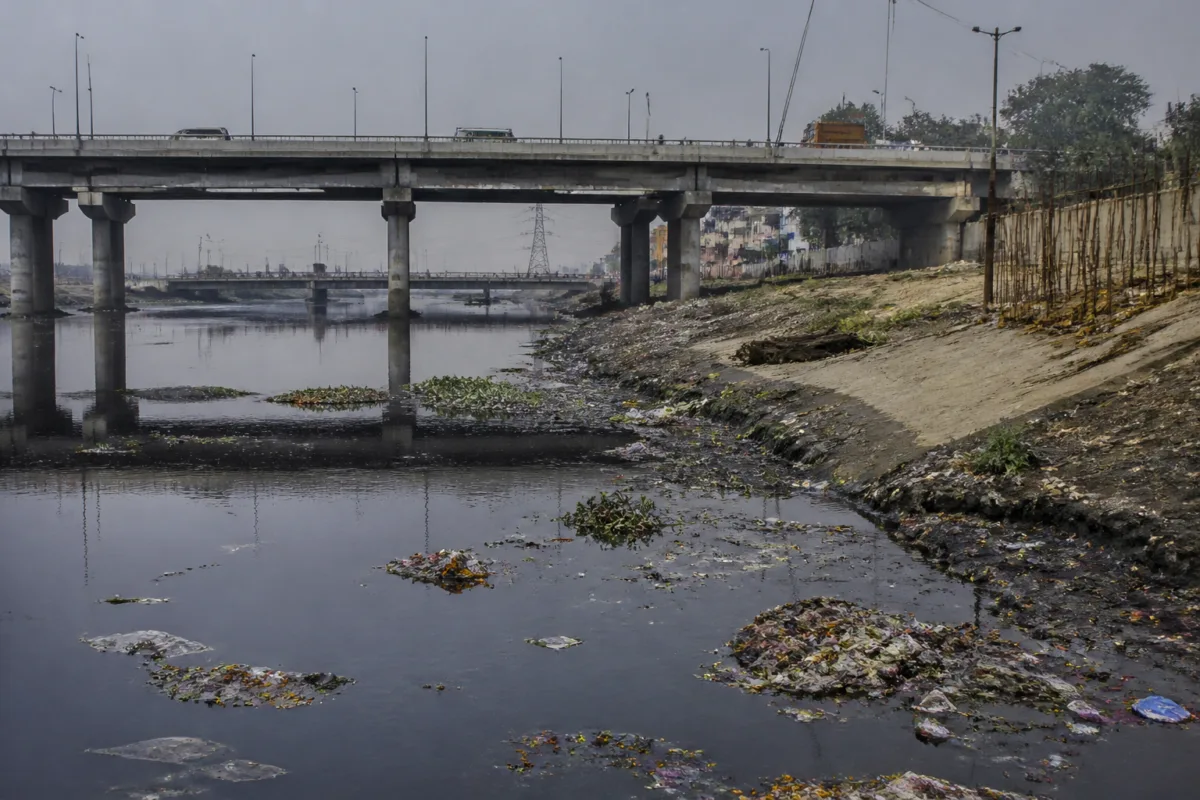
The latest figures cited from a Delhi Pollution Control Board report show that Yamuna pollution is not evenly distributed across Delhi. The highest biochemical oxygen demand was recorded at the ISBT Bridge, while Asgarpur recorded the highest faecal coliform level among the five locations listed. Together, the indicators show how sharply river water quality deteriorates at different points through the capital’s urban stretch.
The findings are significant because they move the discussion beyond a single visual episode or political accusation. The report, published on September 30, 2026, is based on samples collected from different parts of the Yamuna on September 7. Its measurements cover biochemical oxygen demand, faecal coliform and dissolved oxygen—three indicators that describe different aspects of water quality and aquatic stress.
The figures cited in the report are particularly stark when compared with the bathing-water standards mentioned in the source material. A BOD level of 3 milligrams per litre is identified as the standard associated with water suitable for bathing. Against that benchmark, the reading at the ISBT Bridge was 30 milligrams per litre, or ten times the stated limit. ITO Bridge recorded 18 milligrams per litre, Asgarpur 16, Nizamuddin Bridge 12 and Okhla Barrage 10.
### What the Yamuna pollution indicators show
BOD measures the amount of oxygen used by bacteria to break down organic matter in water. A higher BOD reading indicates a greater load of biodegradable organic pollution. In practical terms, the data cited by the report show that all five monitoring locations were substantially above the stated 3 milligrams per litre benchmark.
The range is also important. The difference between 30 milligrams per litre at ISBT Bridge and 10 milligrams per litre at Okhla Barrage means the highest reported reading was three times the lowest among these five locations. That variation suggests that pollution pressure changes considerably along the river rather than remaining constant throughout the monitored stretch.
BOD, however, does not describe the entire water-quality picture. Faecal coliform levels provide a separate indication of contamination associated with human or animal waste. The report cites 2,500 MPN per 100 millilitres as the maximum level for bathing-quality water. The reported readings exceeded that limit at every location listed.
Asgarpur recorded the highest faecal coliform count at 38,000 MPN per 100 millilitres. The source identifies this as 15.2 times the stated limit. ISBT Bridge recorded 35,000, Okhla Barrage 21,000, ITO Bridge 17,000 and Nizamuddin Bridge 15,000. The figures place Asgarpur and ISBT Bridge at the top of the two most severe indicators, although the locations do not follow exactly the same ranking for BOD and faecal coliform.
That distinction matters. A location with the highest BOD is not automatically the location with the highest faecal contamination. The two measures capture different characteristics of pollution, and reading them together provides a more complete picture than relying on one number. In this dataset, ISBT Bridge stands out for organic pollution measured through BOD, while Asgarpur stands out for faecal contamination.
### Why dissolved oxygen adds another layer
The third indicator cited is dissolved oxygen, or DO. Aquatic organisms require dissolved oxygen to survive, and lower levels can make conditions more difficult for fish and other river life. The report says that DO was below the stated standard of 5 milligrams per litre at some monitoring stations, but the supplied material does not specify the readings for each location.
That limitation is important. The BOD and faecal coliform figures allow a direct location-by-location comparison, while the available DO information supports only a broader conclusion: at least some monitored points did not meet the cited standard. A more detailed assessment would require the individual DO readings, sampling conditions and the complete monitoring table.
The available data nevertheless show why river pollution cannot be assessed through appearance alone. Public attention may rise when foam, dead fish or unusual colour becomes visible, but the indicators in the DPCC figures measure conditions that may not be immediately apparent. BOD captures the oxygen demand created by organic matter, faecal coliform signals contamination linked to waste, and DO indicates the oxygen available to aquatic life.
### The administrative meaning of location-wise data
The location-wise spread of the figures is also relevant to how Delhi manages its river. The monitoring points—ISBT Bridge, ITO Bridge, Asgarpur, Nizamuddin Bridge and Okhla Barrage—are not a single site but a sequence of points across the city’s river corridor. Reporting them separately makes it possible to identify where pollution indicators are highest and where conditions differ.
That does not, by itself, establish the source of contamination at any particular point. The supplied report does not provide a discharge inventory, identify specific drains, attribute pollution to a particular agency or explain the reasons for the variation between monitoring stations. It therefore supports a description of the river’s measured condition, but not a definitive finding about responsibility for each reading.
This distinction is especially important in a politically contested environment. The source places the data against public arguments between leaders of the Bharatiya Janata Party and the Aam Aadmi Party over the condition of the Yamuna, including competing claims about dead fish and chemical contamination. Those claims are not independently established by the measurements cited in the report. The DPCC figures can demonstrate that pollution levels were high at the listed locations, but they do not, on their own, verify how a particular episode occurred.
The data also show why a city-wide label such as “the Yamuna is polluted” is insufficient for administration. The river’s condition varies by monitoring point and by indicator. A useful response therefore depends on maintaining consistent sampling, publishing location-specific measurements and tracking changes over time. The supplied material does not establish whether the September readings were higher or lower than previous observations, so no trend can be inferred from this report alone.
### What the evidence confirms—and what it does not
The evidence confirms four central points. First, the five cited locations recorded BOD levels above the 3 milligrams per litre bathing-water benchmark. Second, all five recorded faecal coliform levels above the stated limit of 2,500 MPN per 100 millilitres. Third, Asgarpur had the highest faecal coliform reading, while ISBT Bridge had the highest BOD reading. Fourth, dissolved oxygen was below the cited 5 milligrams per litre standard at some monitoring stations.
The evidence does not establish the precise causes of the readings, the performance of individual sewage or drainage systems, the health risk from direct contact at each site, or whether conditions changed after the samples were collected. It also does not provide a complete dataset for every monitoring location or the exact DO readings.
For residents, the immediate significance is that the water-quality benchmarks cited in the report were exceeded by wide margins at all five locations. For urban institutions, the deeper significance is the need to treat river monitoring as a location-specific and multi-indicator task rather than as a seasonal political talking point.
The next useful development would be the publication of the full DPCC monitoring table, including station-wise dissolved oxygen readings, sampling details and comparable observations across dates. Until then, the September 7 sample set offers a clear but bounded conclusion: Delhi’s Yamuna showed severe pollution at all five cited locations, with the most serious readings differing according to the indicator used.