


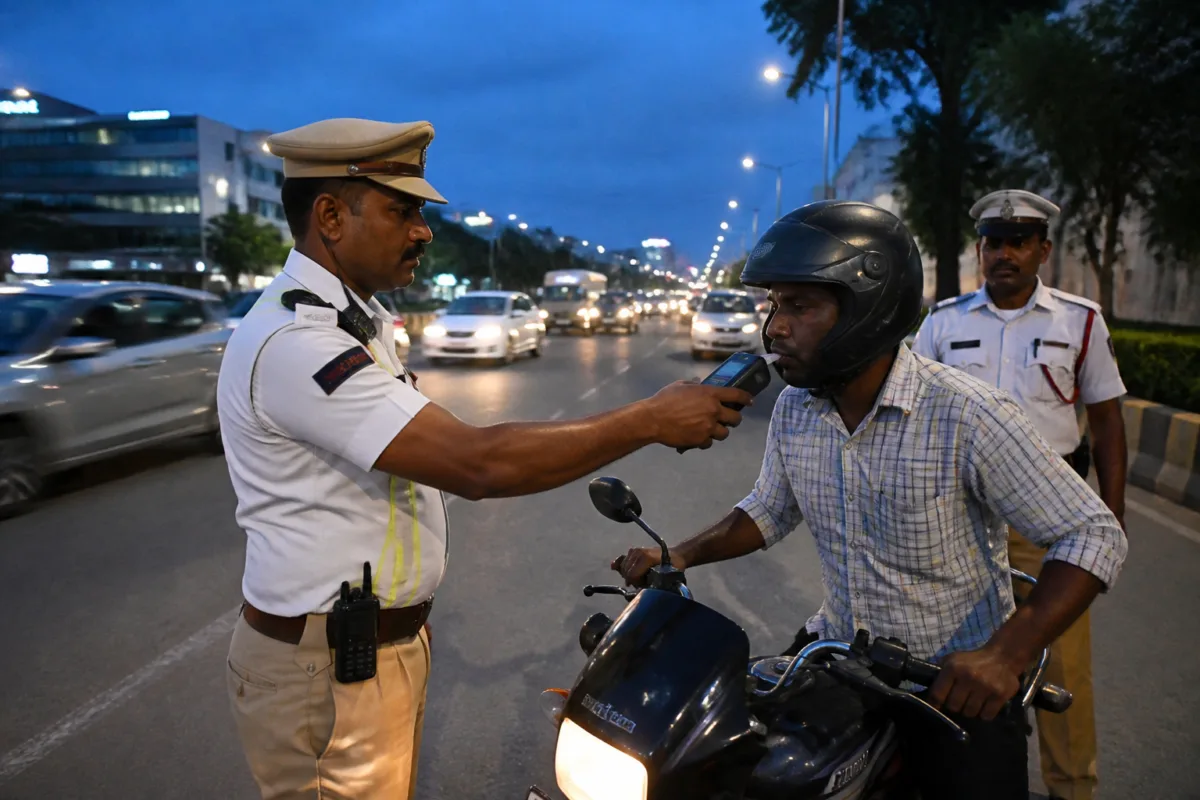
The Hyderabad Traffic Police’s two-day enforcement drive against drunk driving resulted in 578 cases, but the most important pattern in the figures is not the headline total. It is the concentration of offences among two-wheeler riders, who accounted for 495 cases, or nearly 86 per cent of all motorists caught during the operation. The data places the enforcement action within a wider urban mobility question: how road-safety risks are distributed across the city’s everyday transport system.
The drive was conducted on November 6 and 7, according to the Hyderabad Traffic Police as reported by Telangana Today. The enforcement covered two-wheelers, three-wheelers, four-wheelers and other vehicles. Of the 578 motorists caught driving under the influence of alcohol, 28 were three-wheeler drivers, while 55 were driving four-wheelers and other vehicles. The remaining 495 cases involved two-wheelers.
That breakdown matters because vehicle type changes the nature of exposure on the road. The supplied enforcement data does not establish the causes behind the high number of two-wheeler cases, nor does it provide a comparison with the number of vehicles checked in each category. It does, however, show that the recorded enforcement burden was overwhelmingly concentrated among riders of two-wheelers. For an urban transport system in which different road users share limited carriageway space, that concentration is a significant operational signal.
The BAC distribution also shows that the cases were spread across a wide range of recorded alcohol levels. The traffic police reported 115 cases in the 30–50 mg/100 ml range and 257 in the 51–100 range. Another 111 motorists recorded levels between 101 and 150 mg/100 ml. The enforcement drive recorded 52 cases in the 151–200 range, 27 in the 201–250 range and 11 in the 251–300 range. Five motorists recorded levels exceeding 300 mg/100 ml.
Together, these figures account for all 578 cases. The largest single group was the 51–100 mg/100 ml category, representing 257 motorists. The next largest groups were those in the 30–50 range, with 115 cases, and the 101–150 range, with 111 cases. The data therefore does not describe a small cluster limited to the highest recorded BAC levels. It records drink-driving across every range listed by the police, including 283 cases above 100 mg/100 ml and 95 cases above 150 mg/100 ml.
The five cases above 300 mg/100 ml form a small share of the total, but their inclusion demonstrates the range of conditions encountered during the drive. The police have not provided, in the supplied report, the identities of the motorists, the locations of the checks, the times at which they were conducted, or the action taken in each case. Those omissions limit what can be concluded about geographic hotspots, the timing of offences, repeat behaviour or the subsequent legal process.
This limitation is important when reading enforcement numbers. A count of cases is not the same as a citywide prevalence estimate. The 578 motorists were those detected during a specific two-day operation, not necessarily all motorists who drove after consuming alcohol during that period. The supplied material also does not state how many vehicles were screened, how enforcement teams were deployed or whether the drive covered all parts of Hyderabad equally. The figures are therefore best understood as an enforcement snapshot rather than a complete measure of the city’s drunk-driving problem.
Even as a snapshot, the figures provide two useful forms of information. The first is the scale of enforcement activity: 578 motorists were identified in two days. The second is the composition of the detected cases. The 495 two-wheeler cases make up more than four out of every five cases recorded in the operation. That pattern gives transport authorities a basis for examining how enforcement is experienced on roads used heavily by riders, although the supplied report does not say whether the police intend to alter deployment or enforcement methods on that basis.
The traffic police reiterated that drunk driving would attract zero tolerance and said special enforcement drives would continue. Officials also asked motorists to cooperate with the police and avoid driving after consuming alcohol. These statements indicate that the operation is part of an enforcement approach that will continue beyond the two days covered in the report. No further dates, target locations or numerical targets were provided.
The institutional role is clear in the available account. The Hyderabad Traffic Police conducted the enforcement, identified the motorists and recorded the BAC categories. The report does not identify any role for the municipal corporation, transport department, courts, hospitals, insurers or public-transport agencies. As a result, the evidence supports an assessment of police enforcement, but not a wider evaluation of Hyderabad’s road-safety governance system.
The data also raises a practical question about the relationship between enforcement and mobility choices. The operation recorded 495 two-wheeler riders, compared with 55 drivers of four-wheelers and other vehicles and 28 three-wheeler drivers. The source does not reveal whether this reflects differences in travel volumes, enforcement visibility, rider behaviour or the locations selected for checking. Without that information, the figures cannot establish why two-wheeler riders dominated the cases. They can establish that they dominated the detected offences.
That distinction prevents the numbers from being used as a complete explanation of road risk. The report contains no information on crashes linked to the operation, injuries, fatalities, vehicle ownership, passenger status or the age of the motorists. It also does not say whether any of the 578 cases involved collisions or whether all were detected through roadside checks. These are the missing pieces required to connect enforcement activity with actual injury outcomes.
The BAC figures nevertheless make the operation more informative than a simple arrest or violation count. They show a graded distribution, with the largest concentration in the 51–100 range and smaller but still measurable groups at higher levels. Five motorists exceeded 300 mg/100 ml, while 11 were in the 251–300 range and 27 in the 201–250 range. The report does not provide an interpretation of these levels beyond recording them, so the data should not be used to infer impairment severity for individual motorists without additional medical or legal context.
For Hyderabad’s urban system, the central issue is how enforcement data is converted into safer movement. The traffic police have announced continued special drives, but the supplied material does not specify whether future operations will publish location-wise results, vehicle-screening totals, repeat-offender information or outcomes after detection. Without those details, the public can see the scale and composition of the operation but cannot assess its coverage or longer-term effect.
The immediate evidence confirms three points. First, 578 motorists were caught during the November 6 and 7 operation. Second, two-wheeler riders represented the overwhelming majority of recorded cases. Third, the BAC readings extended across all the ranges listed by the traffic police, including five readings above 300 mg/100 ml. What remains uncertain is how representative the operation was of Hyderabad’s wider roads, what action followed each case and whether continued drives will produce comparable data over time. Those are the developments that will determine whether the enforcement figures become a continuing road-safety dataset or remain a two-day snapshot.