


Delhi’s budget utilisation has slowed sharply in the first half of the 2026-27 financial year, with the government spending Rs 19,071.5 crore, or 30.5%, of the Rs 62,550 crore allocated for schemes, programmes and projects by September 2026. The figures point to a wider implementation problem: the size of an urban budget does not by itself determine how quickly transport, water, sanitation, welfare and other public programmes reach residents.
The spending data, reported by the Times of India citing official figures, show substantial differences between departments. Industries used only 1.7% of its allocation, tourism 6.4%, nutrition 8.7% and women and child welfare 8.9%. At the other end, minor irrigation and flood control recorded the highest utilisation at 61.5%. Among large sectors, transport spent 30% of its allocation, water supply and sanitation 32%, urban development 35.2% and medical services 27.4%.
These numbers should not be read simply as a ranking of efficient and inefficient departments. They reflect different types of public spending, different approval chains and different implementation conditions. A department paying recurring benefits may have a spending pattern unlike one executing a road, drainage or transit project. The government official cited in the report also said that the scheme allocation includes capital works, subsidies, welfare schemes and other programmes, but excludes a separate Rs 41,150 crore establishment and administration budget.
That distinction is important for understanding what the 30.5% figure measures. It is not the expenditure rate for Delhi’s entire Rs 1,03,700 crore budget outlay for 2026-27. It covers the identified allocation for schemes, programmes and projects. The remaining six months therefore cannot be judged only by comparing the expenditure with the total annual government budget. The relevant question is whether departments can convert their sanctioned allocations into tenders, contracts, payments and completed services within the financial year.
The first-half figures suggest that the conversion process is uneven. Energy used 48.8% of its allocation, general education 45.3% and SC/ST/OBC welfare 49.4%. By contrast, agriculture, rural development, civil supplies and environment were among the sectors with low expenditure. Women and child welfare had a substantial allocation of Rs 7,161 crore but spent Rs 639.2 crore, or 8.9%, by September. Industries spent Rs 4.71 crore out of Rs 274 crore.
For urban residents, the most consequential figures are those attached to sectors that shape everyday service delivery. Transport received the largest allocation among the listed sectors, at Rs 11,834 crore, but had used 30% by the halfway point. Water supply and sanitation recorded 32% utilisation, while urban development stood at 35.2%. The report does not establish which individual projects account for the spending or whether specific projects have been delayed. It does, however, show that aggregate utilisation in several core urban sectors was below half of the annual allocation.
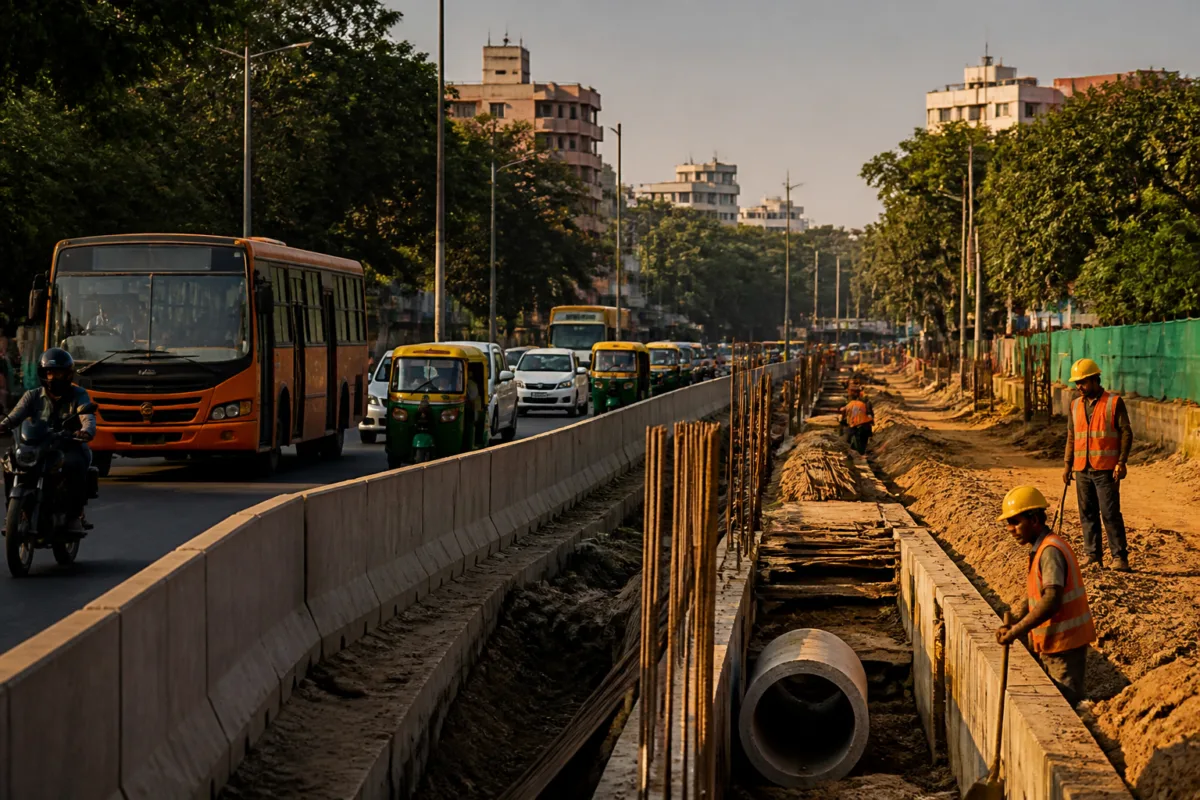
Budget implementation is not a single transaction. Departments must first translate an allocation into an approved programme, secure administrative and financial approvals, prepare technical details where required, invite and evaluate tenders, award contracts and then certify work or supplies before expenditure is recorded. The official cited by the report said spending is often slower between April and September because departments take time to obtain approvals, finalise tenders and award contracts. Construction and infrastructure projects may also face disruption during the monsoon.
This administrative sequence helps explain why a low first-half figure is not conclusive evidence that a programme has failed. A project may have moved through planning and tendering without a large payment being recorded. Conversely, a late surge in expenditure may increase pressure on departments to spend quickly, without demonstrating that the intended physical work or service has been delivered. The supplied data do not provide project-level completion figures, so they cannot determine which of these situations applies to each department.
The risk identified by another official is the concentration of expenditure in the final quarter, particularly between January and March. When departments have to use a large share of their remaining allocations in a short period, the process can involve hurried tendering, reduced scrutiny and pressure to certify work before the financial year closes. The official warned that this may affect the quality of work. That is a risk assessment attributed to the official, not a finding that such compromised work has already occurred in Delhi during the current financial year.
The September alert issued to departments adds an important governance layer. The Delhi government reportedly warned departments about underutilisation of original budget allocations and cautioned those seeking supplementary grants against making unrealistic demands for additional funds. This indicates that the administration is examining both sides of the budget process: why approved funds remain unused and whether departments should receive more money while existing allocations are still largely unspent.
That tension is common to large public budgets. Departments need adequate funds to maintain services and execute projects, but unused allocations can indicate that planning, procurement or implementation capacity has not kept pace with financial commitments. Supplementary grants may be justified when costs change or new requirements emerge, but the report shows the government linking requests for additional funds to the performance of existing allocations.
The data also complicate any simple interpretation of sector performance. Minor irrigation and flood control recorded 61.5% utilisation, but the report does not identify whether this reflects completed works, recurring expenditure or payments made against a smaller number of projects. Similarly, energy and education recorded relatively high utilisation, but the aggregate figures do not reveal the quality, reach or physical progress associated with that spending. Financial utilisation is therefore a necessary indicator of implementation, but not a complete measure of public value.
For transport, water supply, sanitation and urban development, the gap between allocation and expenditure has a particularly visible institutional consequence. These sectors depend on coordination among departments, agencies, contractors and local systems. Delays in approvals or procurement can push construction and service-related payments into the second half of the year. The report does not specify whether the low utilisation resulted from land, design, tender, contractor or inter-agency issues, so the causes cannot be assigned to any one bottleneck.
What the figures establish is a fiscal timing problem with potential delivery implications. By September, Delhi had spent less than one-third of its scheme, programme and project allocation. Several sectors were below 10%, while major urban sectors were clustered around 27% to 35%. The remaining six months will carry a substantially higher share of the year’s spending requirement, especially for departments with single-digit utilisation.
The larger urban question is whether Delhi’s budgeting system is being judged mainly by the money allocated or by the public works and services delivered. The available figures show a sizeable gap between sanctioned plans and recorded expenditure, but they do not yet show how much of that gap reflects normal project sequencing, monsoon-related disruption, administrative delay or weak execution. The next useful evidence will therefore be project-level spending, tender awards, physical progress and end-of-year expenditure quality.
For now, the official data support two conclusions. Delhi’s FY2026-27 scheme spending was slow through September, and the shortfall was unevenly distributed across departments. The government has recognised the underutilisation and warned against unrealistic supplementary demands. Whether the remaining six months produce a measured acceleration or a last-quarter rush will determine whether the annual allocations translate into timely urban infrastructure, welfare delivery and public services.