


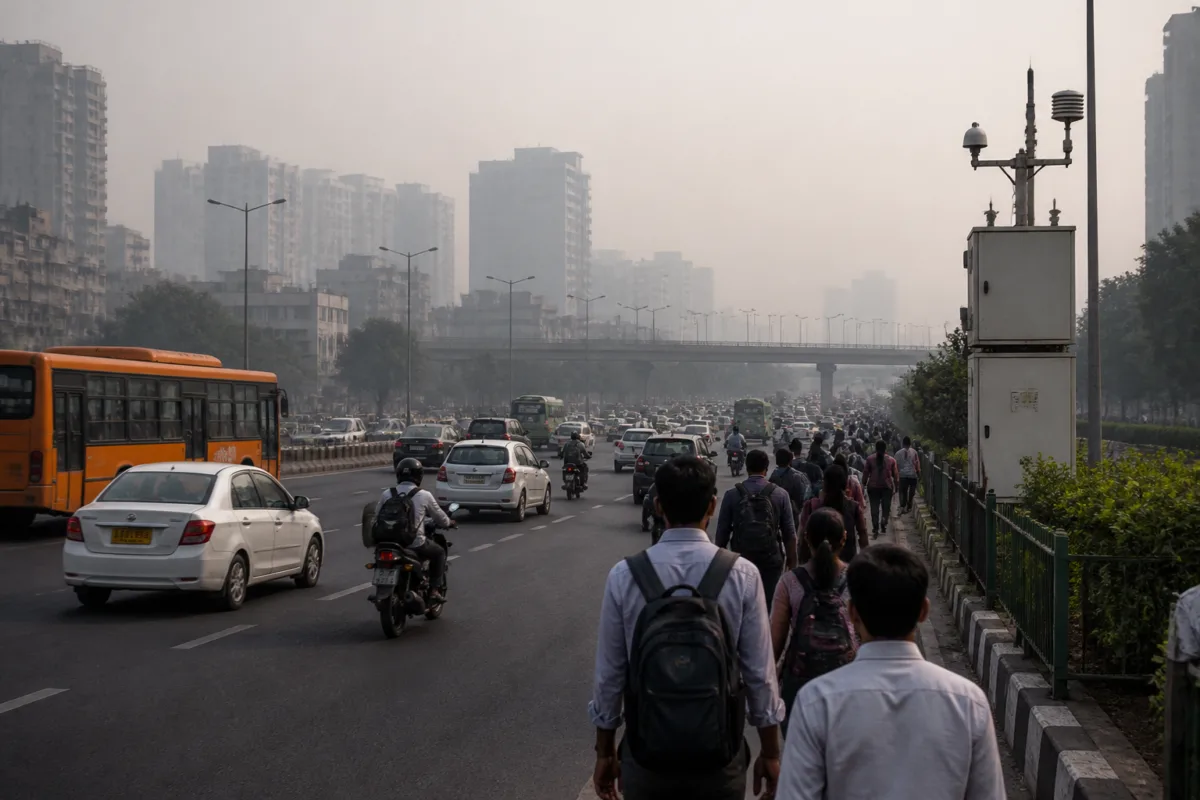
Delhi’s air pollution improved in October compared with several previous years, but the reduction has not brought particulate pollution within the national annual standards cited in the available data. That gap matters because it separates a better month from genuinely safe air: the city recorded lower average levels of PM2.5 and PM10 up to 25 October, yet both remained substantially above the relevant benchmarks.
The figures, reported by Jagran and based on data from the Central Pollution Control Board and the Commission for Air Quality Management, were compiled on the EnviroCatalysts dashboard. The comparison is between Delhi’s average levels up to 25 October this year and the full-October averages recorded in previous years. That basis makes the data useful as an indication of how this October is progressing, but it also means the comparison is not between identical time periods.
The central finding is therefore two-sided. Delhi’s pollution burden has eased when compared with earlier October averages, particularly the severe levels recorded in 2016. But the city’s air remains polluted by the standards cited in the report, and the improvement cannot by itself be read as a resolution of the underlying problem.
## Improvement from a high base
According to the reported figures, Delhi’s average PM2.5 concentration was 67 micrograms per cubic metre up to 25 October this year, compared with 147 micrograms per cubic metre in October 2016. PM10 declined from 345 to 172 micrograms per cubic metre over the same comparison. The report also records lower average levels of nitrogen dioxide and ozone than in previous years, while carbon monoxide was at a level similar to last year.
The decline in PM2.5 is significant in numerical terms: the reported average fell by more than half compared with the October 2016 figure. PM10 also dropped markedly from the 2016 level. Yet the comparison does not mean that Delhi’s air has moved into a low-pollution range. The national annual standards cited in the report are 40 micrograms per cubic metre for PM2.5 and 60 micrograms per cubic metre for PM10. This year’s reported averages of 67 and 172 remain above those levels.
That distinction is essential to interpreting air-quality data. A lower concentration than in an exceptionally polluted earlier period can coexist with exposure levels that remain harmful. In other words, improvement is a trend, while compliance with a standard is a threshold question. Delhi’s October data, as presented, shows progress on the first measure but not on the second.
The numbers also need to be read with care because the current average runs only up to 25 October, while previous years are represented by their full-October averages. The final October average could change once the month is complete. The supplied report does not provide a station-by-station breakdown, daily distribution, or the number of monitoring locations included in the dashboard, so it cannot establish whether the improvement was evenly spread across Delhi or concentrated in particular parts of the city.
## What the pollutants reveal
PM2.5 and PM10 are the most prominent indicators in the report because both remain above the cited national annual standards. PM2.5 refers to very small particles that can travel deep into the lungs, while PM10 can worsen breathing difficulties. The report also notes that PM2.5 exposure is associated with respiratory and cardiovascular risks.
The difference between the two measures is relevant to how urban residents experience pollution. A city can record a lower average than in previous years while still exposing people to a substantial particulate load. The data does not describe only a temporary roadside nuisance; it points to a wider urban exposure that affects residents across daily activities, including commuting, work and time spent outdoors.
The other pollutants add context but do not erase the particulate concern. Nitrogen dioxide and ozone were reported at lower levels than in previous years, while carbon monoxide remained similar to last year. The supplied report does not provide the precise values for those pollutants, so the extent of their change cannot be assessed from the available material. What can be established is that the improvement was not uniform across every pollutant: carbon monoxide did not show the same reported decline.
This is one reason a single air-quality label can conceal different pollution patterns. The city’s overall condition depends on several pollutants, their sources, their movement through the atmosphere and the timing of exposure. The data cited here supports a narrower conclusion: Delhi’s October averages for several major pollutants were lower, but the particulate averages remained above the standards mentioned in the report.
## Weather is part of the urban pollution system
Sunil Dahiya, founder and chief analyst at EnviroCatalysts, said pollution levels also depend on wind speed, temperature, humidity and rainfall. These factors influence how pollutants disperse, accumulate or are removed from the air. The report says winter conditions can cause pollutants to remain closer to the ground, allowing pollution levels to rise quickly.
This observation places the October figures within a seasonal system rather than treating them as a standalone performance score. The same emissions burden can produce different measured concentrations depending on atmospheric conditions. When dispersion is limited, pollutants can accumulate near the surface where people live and travel. When conditions are more favourable, concentrations may fall even if the underlying urban activities generating emissions have not changed to the same extent.
That distinction is important for governance. A favourable month can reflect a combination of emissions control and weather conditions, but the supplied evidence does not separate those effects. The reported data shows what was measured; it does not establish how much of the improvement came from changes in traffic, construction, industry, waste burning, dust or other possible sources. No source-specific emissions breakdown is provided in the article.
The seasonal warning also means that October’s lower average cannot be treated as a guarantee for the rest of the winter. Dahiya’s statement, as reported, identifies the meteorological conditions that can worsen pollution, but it does not forecast a specific concentration or episode. The evidence supports vigilance, not a prediction.
## The measurement question matters
The use of CPCB and CAQM data gives the reported comparison an identifiable institutional basis. EnviroCatalysts has presented the figures through its dashboard, using averages up to 25 October for the current year and full-October averages for earlier years. For readers, that makes the source chain visible: the dashboard is the platform presenting the comparison, while the underlying data is attributed to national and regional air-quality authorities.
At the same time, the comparison has limits that should remain visible. Annual standards are being used as a reference point for October averages. The report does not state that a monthly average is itself a direct legal compliance test, nor does it provide the full methodology needed to assess compliance across all monitoring stations and time periods. The strongest supported conclusion is therefore that the reported October averages exceeded the national annual standards cited by the report.
More detailed evidence would be needed to explain the citywide pattern fully. That would include daily readings, station-level data, pollutant-specific values for all indicators, and a comparison covering the completed month. Without those details, the figures establish the broad direction but not the precise causes or geographic distribution of the change.
## The larger urban question
Delhi’s October data highlights a recurring governance challenge: better performance against a polluted baseline can still leave residents exposed to unhealthy conditions. The city needs both short-term monitoring and a longer-term understanding of whether reductions are sustained across seasons. The supplied report does not identify a single intervention responsible for the improvement, so it cannot support claims that any one policy or enforcement measure produced the result.
The institutional arrangement is nevertheless clear at the level described in the report. CPCB and CAQM data are being used to track air quality, while an external environmental think tank has assembled and interpreted the comparison. That relationship can help make complex pollution data accessible, but it also makes methodological transparency important. Readers need to know which period is being compared, which pollutants are included and how the averages are calculated.
For citizens, the practical message is neither that October was unchanged nor that Delhi’s air has become safe. The evidence points to an improvement that remains incomplete. PM2.5 and PM10 were lower than in earlier October comparisons, but the reported averages stayed above the national annual standards of 40 and 60 micrograms per cubic metre respectively.
The next stage of understanding will depend on the completed October average and subsequent winter data. The key questions are whether the lower readings persist, how the pollutants behave under less favourable weather, and whether the improvement is visible across the city rather than only in the aggregate. Until those questions are answered, Delhi’s October air-quality story remains one of measurable progress without adequate relief.