


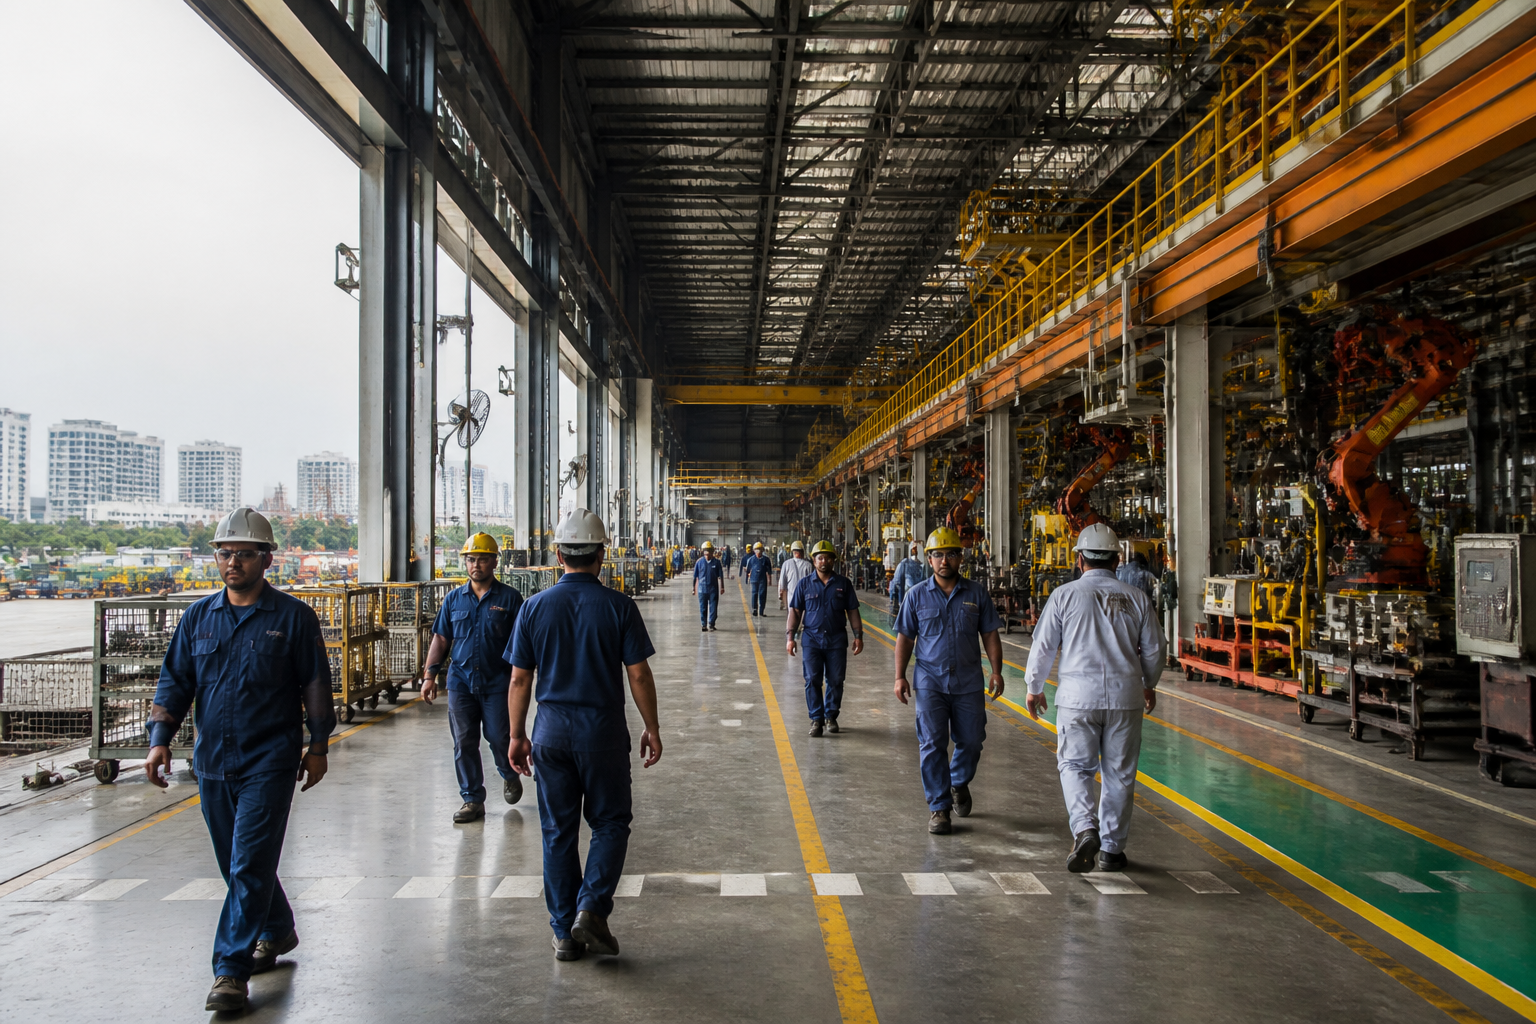
Tamil Nadu manufacturing has achieved what many Indian states seek: scale. It has the country’s largest number of factories and factory jobs, yet the latest Annual Survey of Industries (ASI) data shows that this industrial footprint is not generating value at the same pace as the state’s leading competitors. The central challenge is no longer whether Tamil Nadu can attract and organise manufacturing activity, but whether its factories can move up the value chain, deploy more capital per worker and raise productivity and wages.
The Union ministry of statistics and programme implementation released the ASI results for FY25 last week. Based on 86,547 units and covering registered manufacturing across India, the survey offers a snapshot of the organised industrial economy. Its findings place Tamil Nadu first in factory count and employment, but third in gross value added (GVA), behind Maharashtra and Gujarat.
Tamil Nadu has 41,221 factories, accounting for 15.44% of India’s total of 2,66,931. Its factories engage 31.5 lakh people, or 14.99% of the national workforce covered by the survey, including 26.1 lakh workers. That is around 4.9 lakh more workers than Gujarat and 6.1 lakh more than Maharashtra.
But the state’s share falls when the measure shifts from the number of establishments and people employed to the value produced. Tamil Nadu’s factories generated output of Rs 17.96 lakh crore and GVA of Rs 2.94 lakh crore in FY25. These figures represented 10.87% and 10.90% of the respective national totals, below the state’s roughly 15% shares of factories and factory employment.
Maharashtra recorded the highest GVA at Rs 4.29 lakh crore, followed by Gujarat at Rs 3.80 lakh crore. Tamil Nadu therefore employed more people than either state but generated Rs 1.35 lakh crore less GVA than Maharashtra and Rs 0.86 lakh crore less than Gujarat. Karnataka and Uttar Pradesh followed Tamil Nadu in the GVA ranking.
That gap is most visible in GVA per person engaged. Tamil Nadu generated about Rs 9.3 lakh per person, compared with a national average of Rs 12.8 lakh. Maharashtra recorded Rs 15.6 lakh per person, Karnataka Rs 15 lakh and Gujarat Rs 13.9 lakh. Among the 12 states with more than five lakh people engaged in factories, Tamil Nadu ranked 11th on this measure. Only Uttar Pradesh, at Rs 9.8 lakh, was close to it among the six largest industrial states by net value added.
The comparison with Karnataka is particularly revealing. Karnataka has less than half Tamil Nadu’s factory workforce but generates about 60% more GVA per person. The contrast suggests that employment scale alone does not determine industrial strength. The composition of manufacturing, the size of plants, the capital deployed behind each worker and the value captured by firms all influence what the industrial base contributes to the wider economy.
The same pattern appears in average factory output. A Tamil Nadu factory produces about Rs 43.6 crore of output a year, roughly 70% of the national average of Rs 61.9 crore. The average factory employs 76 people, slightly below the national average of 79 and well below Maharashtra’s 100. This does not establish that smaller factories are inherently inefficient, but it does show that Tamil Nadu’s industrial base is characterised by relatively modest output per establishment.
For cities and industrial regions, this distinction matters because factory count is only one measure of industrial development. A large number of units can support employment, supplier networks and local demand, but the quality and resilience of that economic base also depend on wages, productivity, investment and the ability of firms to produce higher-value goods. The ASI figures show that Tamil Nadu’s industrial geography has succeeded in distributing factory employment at scale, while remaining less successful at producing comparable value per worker.
Capital deployment offers one explanation. Tamil Nadu’s factories held fixed capital of Rs 4.36 lakh crore, equal to 8.53% of the national total. This was the third-highest state share, behind Gujarat at 19.87% and Maharashtra at 12.26%, but it was only about 55% of Tamil Nadu’s share of factories. In other words, the state has a much larger share of factories than of fixed capital.
The data also indicates that the issue is not simply poor use of the capital already installed. Tamil Nadu generated Rs 0.67 of GVA for every Rs 1 of fixed capital, above the national average of Rs 0.53 and close to Maharashtra’s Rs 0.69. The evidence points instead to lower capital per worker and lower capital intensity across the industrial base. Tamil Nadu’s factories may be using existing capital relatively efficiently, but they have less capital deployed behind each worker than the country’s strongest value-creating industrial centres.
Wages reinforce this interpretation. Factory workers in Tamil Nadu earned an average of Rs 2.09 lakh a year, 26% below Maharashtra’s Rs 2.83 lakh and below the national average of Rs 2.28 lakh. Tamil Nadu ranked ninth among the 12 large states on this measure. The combination of low GVA per worker and comparatively low wages indicates that the state’s employment advantage has not yet translated into equivalent gains in worker earnings.
This is an important distinction for urban development. Manufacturing employment is often treated as a straightforward route to rising household incomes, stronger municipal revenues and broader demand for housing, transport and services. That link is weaker when employment expands faster than value creation and wages. A city or industrial corridor can add workers and factories without generating the same level of economic uplift as a more capital-intensive or higher-value manufacturing cluster.
The national context was positive in FY25. Across the registered manufacturing sector, industrial output rose 7.81%, total employment increased 7.19% and emoluments grew 12.08% over the previous year. Tamil Nadu’s challenge therefore emerges during a period of expansion rather than contraction. The question raised by the ASI data is whether the state’s next phase of growth can make its industrial base more productive, capital intensive and remunerative while preserving the employment scale it has already built.
The institutional policy issue is broader than attracting individual factories. Factory numbers are influenced by industrial land availability, approvals, infrastructure access, supplier ecosystems and the ability of firms to operate formally. But higher GVA per worker requires additional conditions: investment in productive equipment, larger or more capable plants, stronger connections to higher-value supply chains and production that captures more value within the state. The supplied ASI figures do not identify which sectors or districts account for the gap, so they cannot by themselves establish the precise policy cause.
They do, however, provide a clear benchmark for evaluating industrial policy. Tamil Nadu’s 15.44% share of factories and 14.99% share of factory employment are substantial achievements. Its 10.90% share of national GVA, Rs 9.3 lakh GVA per person and Rs 2.09 lakh average annual wage show where that scale is not yet translating into equivalent economic value. The state’s fixed-capital share of 8.53% is another measurable signal of the investment gap.
For planners, the lesson is that industrial expansion cannot be assessed only through the number of units approved or jobs announced. The more consequential indicators are the value generated per worker, capital invested per worker, output per factory and wages paid. These measures connect industrial policy to the lived urban economy: the quality of jobs, the capacity of households to afford housing and services, and the strength of the economic base supporting growing settlements.
Tamil Nadu’s manufacturing story is therefore neither one of failure nor of unqualified success. The state has built India’s broadest organised manufacturing platform by factory count and employment. The FY25 ASI results show that its next challenge is to convert that breadth into greater depth: more capital behind workers, higher output per factory, stronger value addition and better pay. Whether it can do so will determine whether its industrial cities remain primarily employment centres or become higher-value engines of urban prosperity.
